The SP 500 has fallen 8.5% – 9%, the last two weeks. Ugly.
The 10-year Treasury yield ended August, ’22 at 3.13%, today it closed at 3.70%. The 10-year yield jumped 25 basis points this week alone. That’s anathema for stocks. It’s like running a marathon with a piano on your back.
Here’s the June ’22 lows for the major indices:
- SP 500: 3,636.87
- Nasdaq Comp: 10,565.14
- Nasdaq 100: 11,037.21
- Dow 30: 29,653.29
- Russell 2000 (IWM): 162.78
- Per the technical software (Worden), Friday, September 23rd’s low for the SP 500 was 3,647.47.
All these lows occurred the week of June 17th, 2022.
SP 500 data:
- The forward 4-quarter estimate (FFQE) for the week ended 9/23/22 was $230.68 down from last week’s $232.35 and July 1’s $241.22;
- The PE ratio as of the close on 9/23/22 was 16x;
- The SP 500 earnings yield jumped to 6.25% this week from last week’s 6% even and July 1’s 6.31%. The high for 2022 was the week of June 17th’s 6.42%, coinciding with the June bottom for the SP 500;
The rate of change for the 2022, 2023 and 2024 calendar year SP 500 estimates:
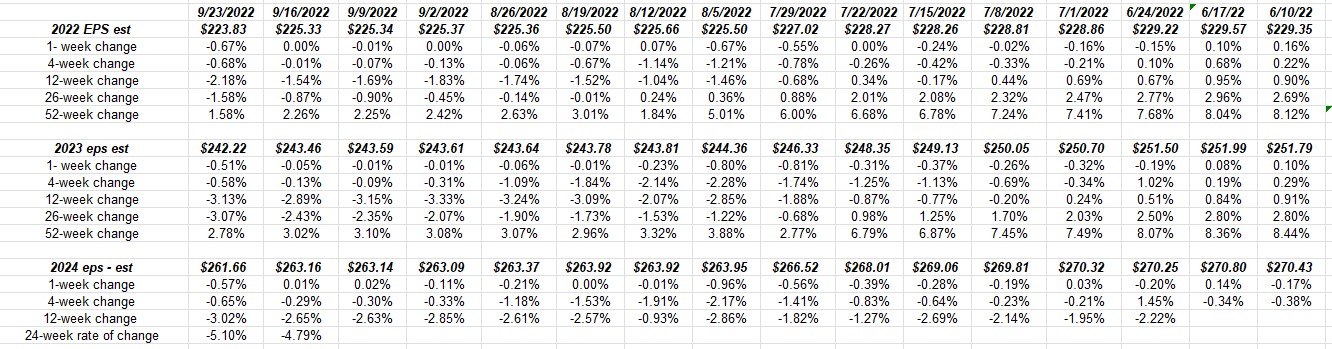
Readers can see the slow drip lower of calendar year EPS estimates for the SP 500, and can also see the progression over longer-time frames.
Some of this data is still “Covid-distorted” but as we enter the end of 2022 i.e. the 4th quarter, and into 2023 the data will start to look more normal again.
A Longer Perspective on annual SP 500 EPS Growth:
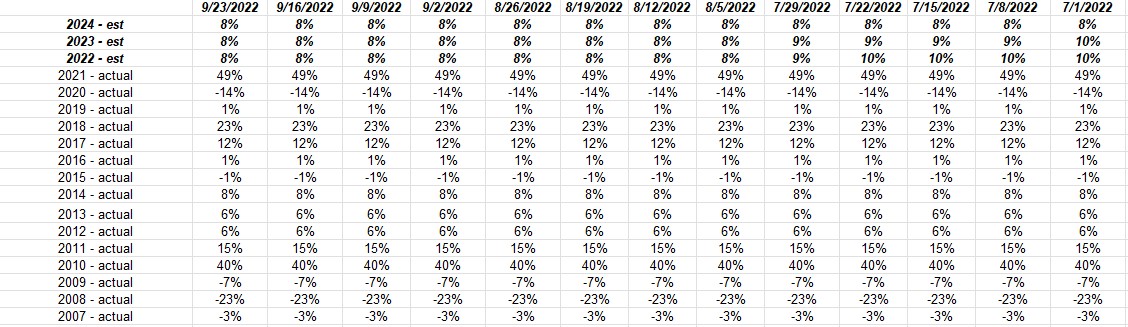
Here’s a table rarely shown to readers: it’s the annual SP 500 EPS growth for dating back to 2007.
The years around the mortgage crisis or great financial crisis, – 2007, 2008, and 2009 – saw the SP 500 EPS decline y.y for 3 years in a year, for a cumulative drop of 33%.
Now look at the top three lines i.e. the “expected” growth for SP 500 earnings for the next three years. The average is 8% (obviously) and it’s been steady since early July ’22. That doesn’t mean that these expected growth rates will materialize but it’s the market’s “best guess” so far.
Ed Yardeni, the Dean of SP 500 earnings forecasters, lowered his 2022 annual EPS estimate to $215 several weeks ago. Given the current estimate as of today of $223.83, that is just an $8 and change reduction, which isn’t too bad give the news around the market.
The recession fears around earnings are being talked about, but are not yet in the estimates. The problem is – like a FedEx – when the guide-downs start, it gets ugly quickly. And as last week’s data indicated, the number of weeks seeing positive EPS revisions over 50% during the last flood of Q2 ’22 earnings reports, was zero. The first time that we’ve seen a whiff since April – May, 2020.
Scheduled earnings releases for coming week:
Wednesday, Sept 28th: Paychex (PAYX) is always of interest since Paychex and ADP have a first-hand look at private sector payroll data, which usually gets vetted in the earnings release or conference call comments, so that company’s conference call notes are worth a read to gain insight into corporate hiring (or firing).
Nike (NKE) and Micron (MU) report after the bell Thursday, September 29th. Nike is down from $177 and change near it’s peak in November ’21, now scraping $100 per share and the brand seems to be completely intact. Judging by Foot Locker (FL) it’s thought the base case for athletic footwear is solid, which should portend well for Nike. China will be interesting since China is 13% of NKE’s total revenue but 55% of operating income and in Nke’s Q4 ’22 ended May 31 ’22, China revenue and operating income fell 15% and 55% respectively for the quarter. Europe is 27% of Nike’s revenue and 64% of Nike’s EBIT or operating income as of May ’22. Small positions are held currently but looking to get longer. Nike’s current EPS and revenue estimates of $0.92 in EPS and $12.2 billion in revenue are very close to what the estimates were for Q1 ’23 when May ’22’s results were reported.
Micron (MU) is another semiconductor that is suffering thanks to the semi “house of pain” to borrow Jim Cramer’s line.
The goal will be to post earnings previews for both Nike and Micron over on www.seekingalpha.com in the next few days.
Summary / conclusion: So far this year – in 2022 – rising interest rates have caused nothing more than PE compression for the SP 500, as this weeks 16x multiple on the SP 500 indicates. However, investors have to start thinking that given higher interest rates, how long can forward EPS estimates for the majority of the SP 500 continue to hold up ?
I’d bet that Q3 ’22 earnings releases that start in 3 weeks will see management’s very cautious and sell-side analysts very tentative to boost numbers if the market remains in it’s current state.
Everyone is waiting on the earnings shoe to fall. I can’t say it won’t either given the slow degradation in the above numbers.
This is not the environment to make a case for why SP 500 EPS estimates can move higher in the next 90 days. It just seems foolish to make a case like that even though the SP 500 has seen PE compression this year rather than lower forward estimates (as of now). Take this as one opinion with substantial skepticism. Past performance is no guarantee of future results and none of this is a recommendation to buy, sell or hold any security.
It’s tough out there. You know it’s a bad market when the Dow 30 rallied from -700 down on Friday, September 23rd, to close down -486 and it felt like a good day.
Thanks for reading.