There really can be nothing “quick” about an earnings preview to cover the salient points. Here’s a quick (as it can be made) look at the first 3 of big 5 megacap tech stocks reporting this coming week.
Two initial thoughts on the big megacap stocks coming into earnings:
1.) Would have preferred not to see the stock splits with AMZN, GOOGL, TSLA, etc. To me it’s an admission that might be a tougher operating environment for the companies going forward;
2.) There is a high degree of nervousness coming into this week’s earnings for the mega-cap names. SNAP illustrated that this previous week, as it had a big effect on GOOGL’s price action Friday, w/ GOOGL falling 5% and below it’s 50-day moving average. Ad spending and currency is going to be a big issue around earnings this week;
Microsoft (MSFT): reports after the close on Tuesday, July 26th. $1.95 trillion market cap, #2 rank in SP 500 in terms of market cap weight at 3%
Microsoft is down -22.5% YTD as of Friday, July 22, versus the SP 500’s decline of -16.2%.
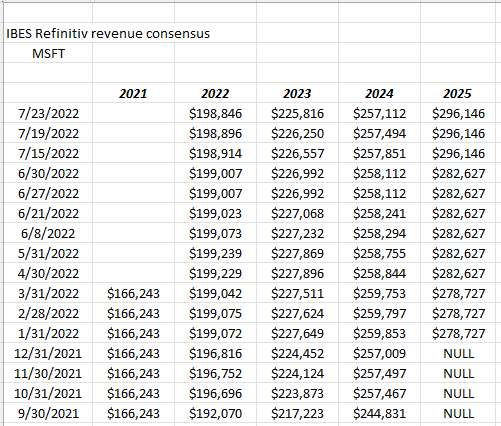
The EPS and revenue estimates for MSFT are $2.29 and $52.45 billion for expected y.y growth of 6% and 14%. Looking at the expected growth in EPS and revenue for fiscal 2023 and 2024 for MSFT, the consensus estimates are still expecting 15% in EPS growth and 14% in revenue growth, and those expected growth rates have been constant the last 4 quarters. There is downward pressure on EPS and revenue consensus, but expected fiscal year growth has remained constant.
Estimate revisions:
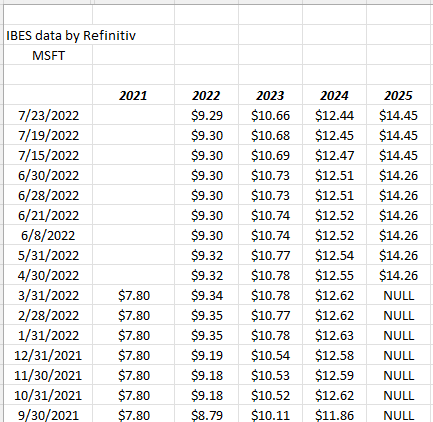
This quarter’s report this week is MSFT’s fiscal Q4 ’22, so readers want to focus on fiscal 2023 and 2024.
All consensus estimates courtesy of IBES data by Refinitiv.
MSFT summary: MSFT has a tough compare against June ’21, where revenue and EPS growth was 21% and 49% respectively. Also, currency is going to play a big issue with fiscal Q1 ’23 guidance and full-year ’23 guidance, although the dollar – per some technicians – has already likely peaked. MSFT guidance was 3% currency impact for Q4 ’22. Azure continues to be the straw that stirs the drink and MSFT’s quarter will likely show Azure’s growth slowing (as it has for some time) albeit at a very gradual rate, as the Intelligent Cloud is now 40% and 41% of MSFT’s total revenue and operating income as of the March ’22 quarter. Azure’s y.y growth is expected at 43% – 45% for Q4 ’22. Since March ’19, Intelligent Cloud’s revenue has grown an average of 24% per quarter, while IC’s operating income has grown 33% (avg) per quarter. Some analysts are watching MSFT’s Office trajectory, as well. Most of the “macro” or top-down research still believe the cloud and thus Azure remain in secular growth cycles, but take that with a grain of salt since those opinions aren’t typically revised until it’s too late. Azure remains the #2 cloud product in terms of market share, to Amazon Web Services (AWS) so this week will give us an update on the cloud growth trajectory from the two major players.
MSFT’s PE has compressed since mid ’21 (last 4 – 6 quarters) from 33x to 28x for fiscal ’22, and from 29x to 24x for fiscal ’23.
Trading at 28x and 29x for fiscal ’22 and ’23, with a 3% free-cash-flow (FCF) yield, the stock price will likely be driven by fiscal ’23 guidance, with current 2023 consensus looking for $10.66 in EPS and $225.8 bl in revenue for expected y.y. growth of 15% and 14% respectively.
Free-cash-flow generation: leaving readers with something proprietary to this blog’s research is always the goal, rather than simply regurgitating widely-help Street opinions, but check MSFT’s free-cash generation over the last 5, 10, 15, and 20 quarters:
- 5 quarter avg: $16.1 billion
- 10 quarter avg: $13.7 billion
- 15 quarter avg: $12.4 billion
- 20 quarter avg: $11.4 billion
My own opinion is that this is Azure’s impact on MSFT operating margins which have risen to the present low to mid 40% range, from the high 20% – low 30% from the middle part of last decade or 2014, 2015, 2016.
Personally, I think MSFT will be ok after earnings, but with nervousness over currency. $105 bl in cash on the balance sheet as of the March ’22 quarter isn’t too shabby either. MSFT has steadily doubled their share repurchases from $3.7 to $4.0 billion as of late 2018 to $8.8 billion as of last quarter. Maybe the 2022 correction, will be the gift that keeps on giving from the share repurchase perspective.
Alphabet (GOOGL): reports after the market close, Tuesday, July 26, ’22. $1.42 trillion market cap w Class A & C shares combining for a 4% (combined) market cap weight in the SP 500.
GOOGL is down -25.5% YTD in 2022 versus the SP 500’s -16% as of Friday, July 22 ’22.
Consensus expectation are expecting $1.29 on $69.9 bl in revenue for Q2 ’22, or expected y.y growth of -10% in EPS on 13% revenue growth.
Ruth Porat warned about the very tough Q2 ’21 comp’s in the April conference call, a quarter where GOOGL grew rev’s 62% and EPS +169% against a very easy Q2 ’20 quarter where revenue fell 2% and EPS fell 29%. Looking at the actual dollars, GOOGL revenue looks to have peaked in Q4 ’21 at $75 bl, although the Q2 ’22 expected consensus revenue estimate of $69.9 billion is sequentially higher than the actual $68 bl in Q1 ’22.
Estimate revisions:
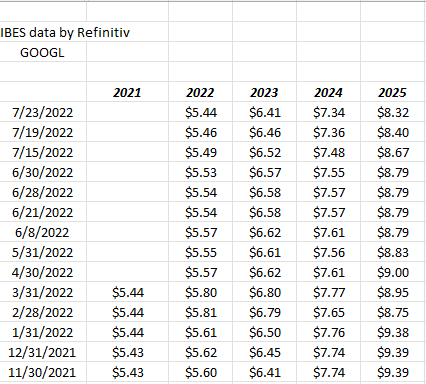
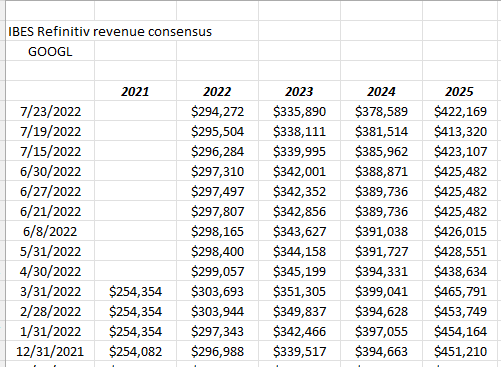
Readers can see there is pressure on both EPS and revenue estimates for GOOGL, with GOOGL’s 2022 EPS down 3% since 12/31/21, but that could easily be currency. GOOGL’s consensus revenue estimate for 2022 has fallen just 1% since 12/31/21, as has the 2023 GOOGL revenue estimate. A 1% revenue estimate reduction in this environment isn’t too shabby, but that’s just an opinion.
Summary: GOOGL’s current consensus is expecting a 3% decline in EPS in calendar ’22 but +18% in 2023, on expected revenue growth of 14% for both years. It’s clear with SNAP’s earnings on Thursday, July 21, that digital ad spending is down, but SNAP doesn’t have GOOGL’s reach either. GOOGL is trading at 20x and 17x the ’22 and ’23 multiple (and 14x and 20x cash-flow and FCF) for an average EPS growth rate over the next 2 years of 7% – 8% so the PEG multiple is pretty salty. GOOGL sports a 5% free-cash-flow yield coming into the earnings report and still has $133 billion or 10% of GOOGL’s market cap in cash & securities on the balance sheet as of the March ’22 quarter. GOOGL hasn’t pulled down their balance sheet cash very much at all, even though the buyback has steadily increased.
We trust in Ruth.
Like MSFT, GOOGL too has seen multiple compression with the stock as GOOGL’s 2022 and 2023 PE has compressed from 26x in mid ’21 to 20x for 2022 and from 23x to 17x for the same period for the 2023 estimate.
What’s interesting to me is that GOOGL cloud is just 9% of GOOG:’s revenue but grew 44% in Q1 ’22. The last 5 quarters have seen Google cloud grow 44%, 45%, 45%, 54% and 46% respectively. Let’s see if that growth can be sustained. Google YouTube ads were hot for a while, but the segment has been a regular 10% – 12% of GOOGL’s total revenue for the 6 quarters, while y.y growth has slowed to 14% in the March ’22 quarter.
I have not seen any research commentary on whether GOOGL cloud is any real threat to AWS or Azure.
No question the quarter will be a challenge for the search giant. The popular opinion is that digital ad spending will be the big metric and currency likely be discussed as well.
Meta: (META) reports their Q2 ’22 Wednesday, July 27th, 2022 after the market close. Meta’s mkt cap has fallen $458 billion and the stock ranks 11th in the SPY market cap ranking with a 1% market cap weight.
Meta Platforms is down 70% YTD as of July 22 ’22, versus the SP 500 -16% return.
META is expecting flat revenue growth on a decline in EPS -28% for Q2 ’22. Consensus estimates are $2.60 in EPS on $28.9 billion in revenue. The consensus revenue estimate is down $2 bl from the April ’22 report and the EPS estimate has fallen from $2.68 to $2.60 (not as harsh).
Estimate revisions:
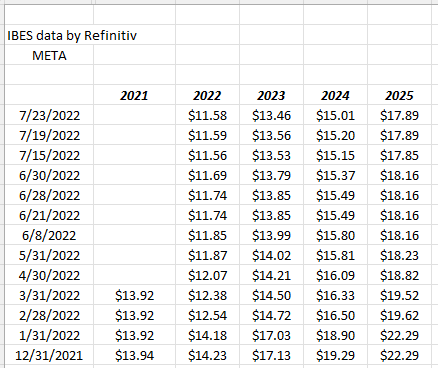
Readers can see the 2022 EPS estimate has fallen 19% since 12/31/21, not a good look coming into earnings. The 2023 EPS has fallen 21.5%.
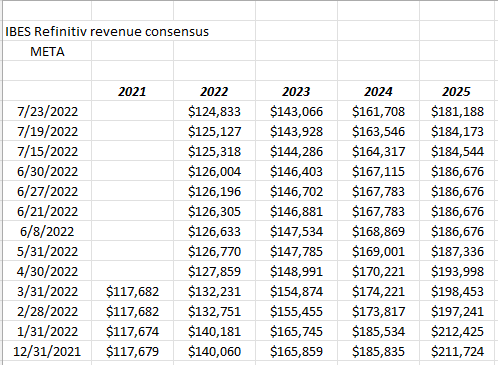
META’s 2022 and 2023 expected consensus revenue estimates have been reduced 9% and 14% respectively since 12/31/21.
Ouch.
Summary: META was sold from the vast majority of accounts in 2017, with the Cambridge Analytica fiasco. However the stock is still trading above where it was sold back then, since (I think) it was disposed of between $150 – $160 per share. Looking at forward EPS estimates for Meta, the Street is looking for an “average” of 1% EPS growth through 2024, with a drop of -16% this year, +17% next year in 2023 and then +3% in 2024. That’s not good with the stock trading at 15x forward earnings.
Realistically, META could trade below $150 and maybe even more reasonable would be a $125 market price, where I’d get interested if the estimates would start to stabilize, or maybe even decline at a more moderate pace.
With that low of an expected EPS growth rate for the next 3 years META should be trading with a 10x or lower multiple. Where META might be getting some benefit is that “average” revenue growth for the next 3 years is 11%, with an expected 6% in 2022, rising to 15% in 2023.
META is currently sporting an 8% FCF yield and a cash-flow and free-cash valuation of 8x and 13x.
The stock is getting completely washed out on the technicals, but I’d think the future really depends on how fast you think the MetaVerse can develop and become material. The consensus estimate revisions are saying that won’t happen that quickly.
The Street was wrong on META in 2012, and 2013 when the old Facebook pivoted to mobile and the stock took off. The IPO peaked out over $40 in 2012 and then the stock slid ultimately below $20 in the summer of 2013 where it ultimately bottomed.
The point is the Street has always underestimated Mark Zuckerberg.
Personally I think the stock is too risky here from all but a sentiment perspective.
That’s just one opinion: there are a lot of high-quality value investors sniffing around the stock here.
Part II with earnings preview on Apple and Amazon, will follow tomorrow along with an expected earnings summary for the week.
It’s a lot of work. If I try and write too much with this level of detail, it takes too long, I get tired and mistakes are made.
Last night was the SP 500 overview of earnings for regular readers, and Microsoft was left out of the opening paragraph.
So far the big issues coming into this week:
- currency influence and “constant currency” impact;
- Digital ad spending for GOOGL and META and maybe even AMZN;
- PE compression has been prevalent this year against very tough comp’s for 2021;
- Everyone’s nervous, particularly the sell-side analysts;
- I do like that expectations and sentiment coming into the reports indicate everyone is cowed.
Thanks for reading. Form your own opinions. Take everything here with substantial skepticism. Don’t be a hero – you don’t need to buy in front of an earnings reports, particularly with a decent secular grower. You’re just gambling. Be patient and if you buy a little late so be it, wait until the downtrends are broken.
Back with more on Sunday, July 24th, 2022.