This blog’s start this week, will be completely different, since we’re starting with some bond market commentary and thoughts.
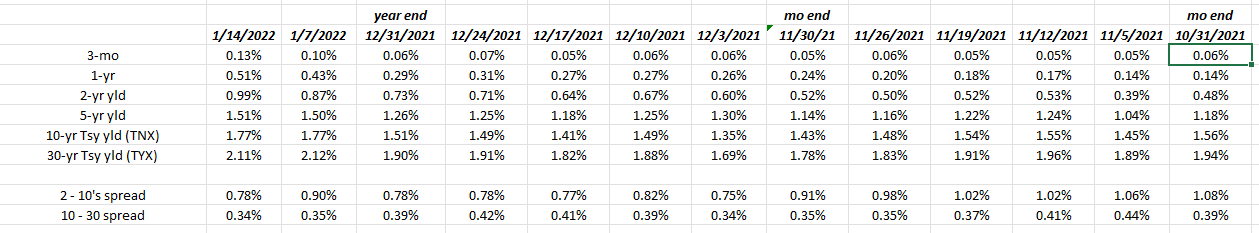
The above spreadsheet begins with the Treasury yield curve as of 10/31/21, just before Jay Powell and the FOMC announced the taper, the week of November 5th, 2021, through Friday’s, January 14th, 2022, close.
Look at the change in the 2-year Treasury yield, just since January 1, 22:
- The 2-year Treasury yield rose 4 bp’s in November ’22 to 52 bp’s;
- The 2-year Treasury yield rose 21 bp’s in December ’22 to 73 bp’s;
- The 2-year Treasury yield rose another 26 bp’s to 99 bp’s the first 14 days of 2022;
- The 10-year Treasury yield rallied 13 bp’s in November ’22 to 1.43%;
- The 10-year Treasury rose 8 bp’s in December ’22 to 1.51%;
- The 10-year Treasury yield has risen a healthy 26 bp’s in the first 14 days of ’22 to 1.77%;
The 10-year Treasury yield has now closed above the March ’21, 1.75% peak, for two weeks in a row.
Return data source: Morningstar
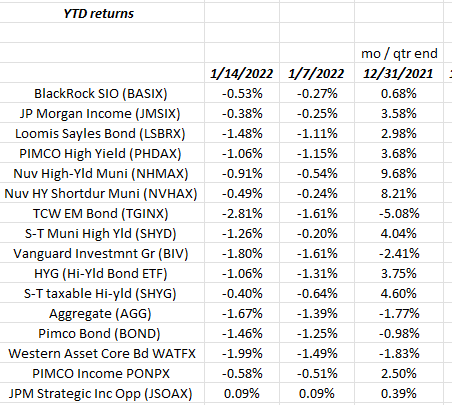
This second spreadsheet was actually started during the depths of the market corrections in March, ’20 and it’s still updated today, every weekend. These bond funds try and cover the scope of the bond markets, although other data not shown tracks the indices. The column to the right is full-year 2021 returns, but the two columns following show returns the first two weeks of 2022.
2022 could be rough on the bond market asset classes, much like 1994.
Blackrock’s Rick Rieder and a slide from this week’s conference call:
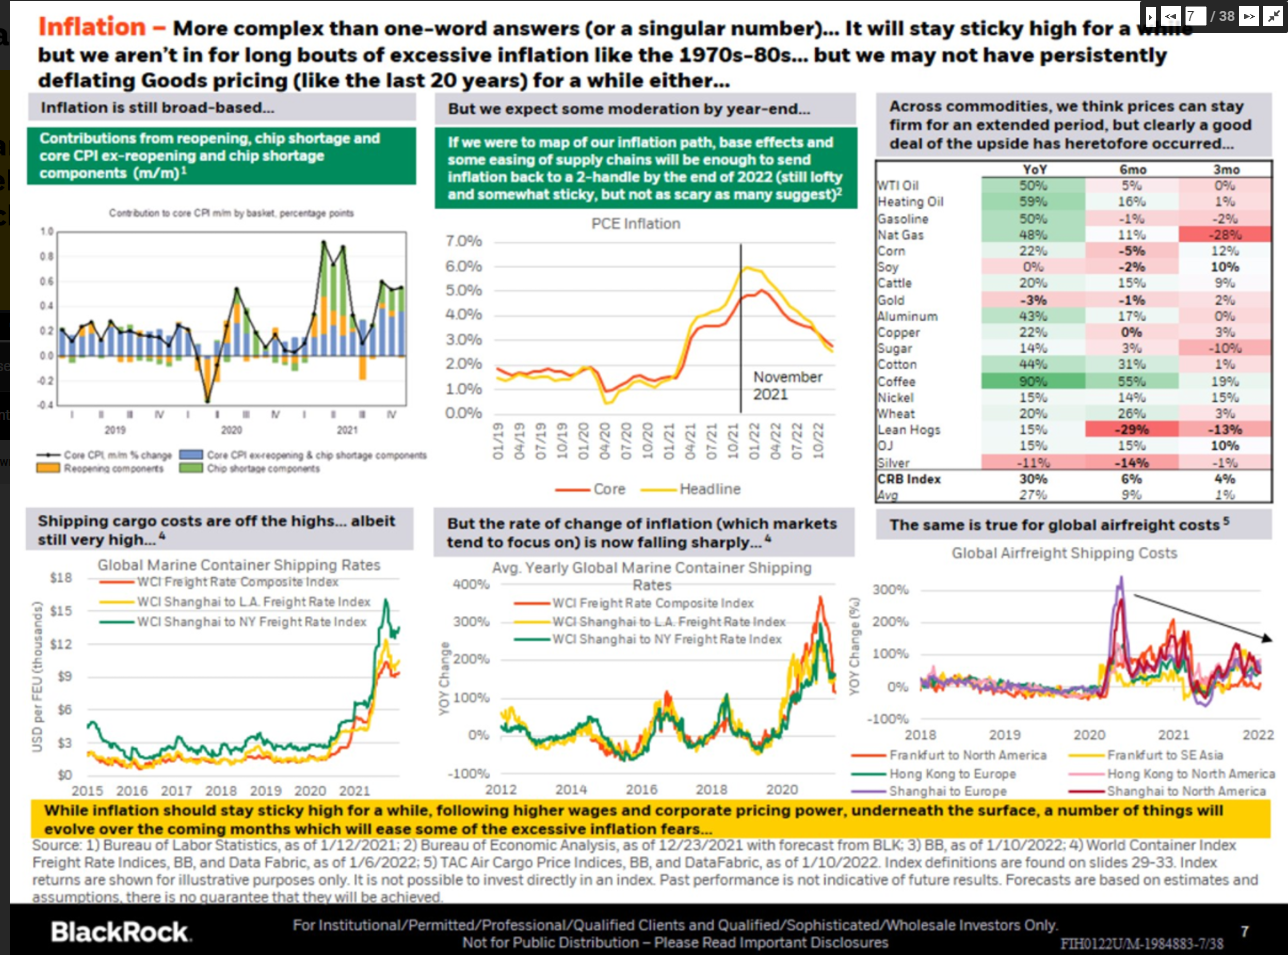
Blackrock’s Rick Rieder does a monthly conference call for investors and it’s one of the best 30 – 45 minutes spent each month. This Thursday morning, January 13, 2022, on page 7, Rick noted that it looks like many of the various inflation indicators are starting to roll over, or the “rate of change” is starting to decelerate.
Bespoke’s detail this week tracking the omicron data (p. 3 of the Bespoke Weekly Report, shows New York cases starting to roll over.
What got my attention was the top, middle graph, or the PCE trend.
SP 500 earnings data:
- The forward 4-quarter estimate this week rose to $223.57 from last week’s $223.25, and two weeks ago $216.14. Remember, with each new start to a quarter, the the forward estimate jumps sharply as the new quarter is added, and the trailing quarter falls off.
- The PE on the forward estimate is now 21x versus the same multiple last week;
- The earnings yield rose this week to 4.79% from last week’s 4.77% and two weeks ago 4.54%. The earnings yield might tell the story this year, if the SP 500 falters and doesn’t produce the kind of historical returns it has (which we expect to happen), and yet SP 500 earnings remain robust. In other words, flat SP 500 in the midst of strong earnings will see “PE compression” and a rising SP 500 earnings yield.
Commentary on Friday’s bank earnings: the reporting vagaries of IBES data by Refinitiv earnings is that the weekly period measures is cut off on Thursday night, thus Friday morning reports during earnings season aren’t picked up in the numbers until the following week. Usually you don’t see a lot of Friday morning EPS reports, but 4 major financial firms did just that last Friday, January 14, 2022, maybe because of the holiday in mid-January every year.
Progression in the calendar 2022 SP 500 EPS estimate:
![]()
Source: IBES data by Refinitiv
This spreadsheet shows the trend in “estimated” 2022 SP EPS as of January 14, ’22 including the bottom-up quarterly estimates, since 10/31/21.
We (investors) are likely to see smaller upside surprises and more “normal” y.y EPS and revenue growth rates for the SP 500 through 2022.
Summary / conclusion: Because of how Refinitiv reports the data, we won’t see the bank and financial reports and their influence on SP 500 EPS from last Friday, until early this coming week, (and the stock market is closed Monday for the Martin Luther King holiday), but then there are a plethora of additional financial earnings reports for Tuesday morning, January 18th, 2022, including Schwab (SCHW), Goldman Sachs (GS) and others.
By next week, investors will have a very good read on the financial sector and it’s impact on SP 500 EPS. The financial sector is 11.5% of the SP 500’s market cap today.
The real point of the SP 500 earnings update today is that – no matter what the numbers tell us over the next 4 weeks – higher interest rates will impact valuation(s), and sector rotation and a transition from growth to value will impact stock prices, probably more than financial performance.
Clients are seeing reductions in “growth” and momentum positions from the last few years, which are being replaced with international, emerging-markets ex-China, and value stocks that haven’t participated in the post-March ’20 stock market rally, and even a little gold for the first time since 2011.
The search for “uncorrelated” is on – the inevitable rotation will occur.
There isn’t really much to add from an SP 500 sector perspective: investors will have to see how the numbers fall out and how the stocks react. I am not expecting the SP 500’s “Top 10” positions to trade well over the next 3 – 6 months, regardless of earnings.
Take this all with a grain of salt and substantial skepticism. Past performance is no guarantee of future results.
Thanks for reading.