Jump to the conclusion below for a quick overview and then come back and read from top to bottom. The companies are listed in the order in which they are scheduled to report this coming week.
Facebook (FB) reports after the closing bell Monday night, October 25th, 2021, after the market close.
Sell-side consensus is expecting $3.19 in EPS on $25.96 billion in revenue for expected y.y growth of 18% and 21% respectively. The SNAP earnings release on Thursday night, 10/21/22 after the close and the issues around the Apple iOS app tracking transparency changes resulted in FB fell $17 or 5% on Friday, 10/22/21, in sympathy with the SNAP issue.
Briefing.com is showing consensus is expecting $3.17 on $29.5 billion so a little lighter than the IBES estimates.
While the sentiment is expecting a tough quarter for FB (and it could happen), the EPS and revenue estimates have been stable-to-positive over the last 5 quarters:
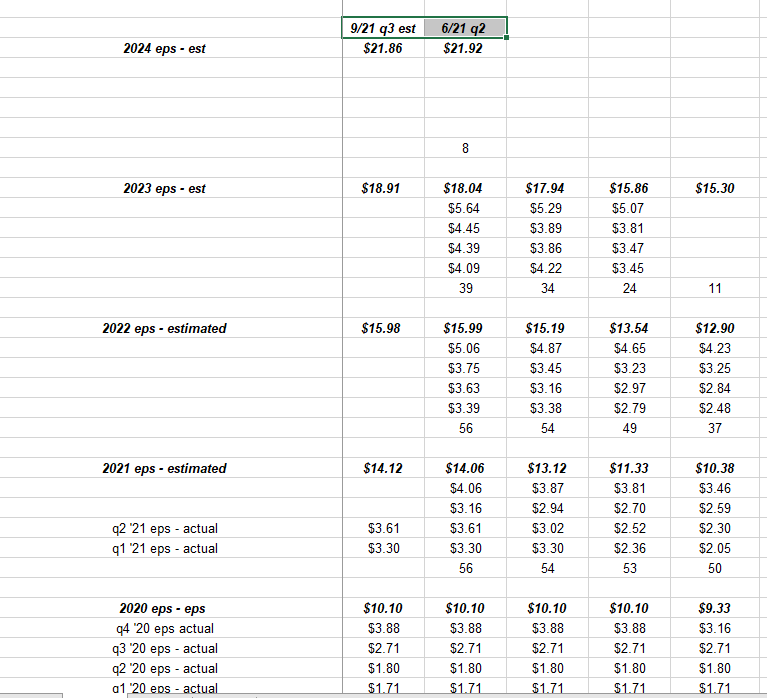
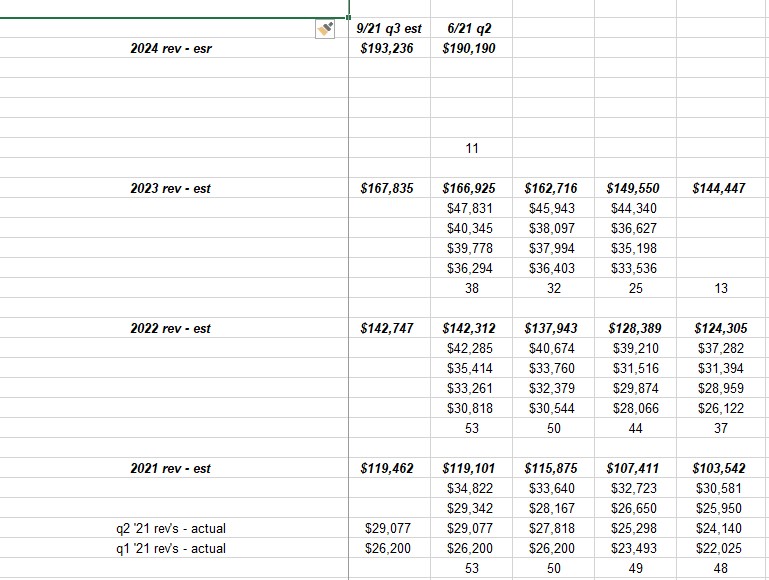
Both data sets are sourced from IBES data by Refinitiv.
Analysis: FB is trading at 23x and 20x ’21 and ’22 expected EPS of $14.12 and $15.98, with the social media giant expecting 40% EPS growth this year and 13% next year. To be frank with readers. the expectation was to see harsher revisions given the price action around the stock, but both EPS and revenue estimates have been firm, in fact revenue estimates are slightly higher over the June ’21 quarter, and the estimate data is as of 10/22/22. FB is trading at 19x and 29x TTM cash-flow and free-cash-flow and cash on the balance sheet represents 7% of FB’s market cap. At $322 per share FB is trading with a 3% free-cash-flow yield.
In the June ’21 quarter, FB’s revenue rose 55% and the metric that caught my eye was that FB saw a 30% increase in the average ad price.
FB tested it’s 200-day moving average recently and held that key technical level.
Alphabet (GOOG/GOOGL):
Google reports after the closing bell on Tuesday, October 26th, and IBES data estimate consensus is expecting $23.48 in EPS on $63.3 billion for expected y.y growth for the Q3 ’21 of 43% and 37% respectively. Briefing.com shows the sell-side consensus expecting $23.22 in EPS and $63.2 billion in revenue. Q4 ’21 consensus per IBES is expecting $25.37 and $71 billion in revenue for expected y.y growth of 14% and 25%.
At it’s current price near $2,700, GOOGL is trading at 27x expected ’21 earnings of $101.03 for 72% y.y growth so it’s pretty clear the sell-side is expecting slower growth ahead. For calendar ’22, calendar EPS is just $106.47 currently expecting just 5% growth in 2022. Expected revenue growth for ’21 and ’22 currently stands at 39% and 17% respectively.
In the June ’21 quarter, YouTube ad rev’s grew 84% and Google cloud revenue grew 54% y.y.
GOOGL EPS and revenue estimate revisions:
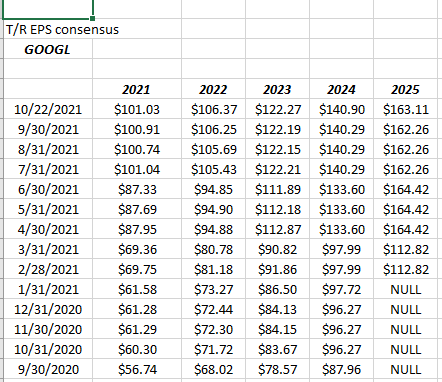
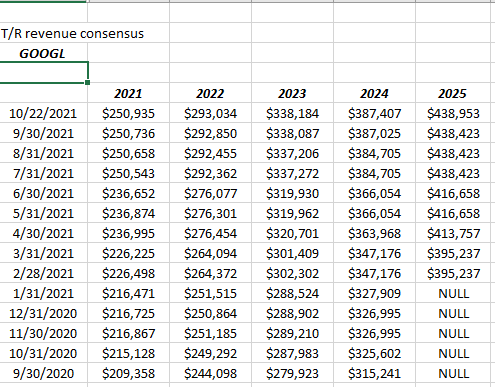
EPS and revenue revision data sourced from IBES data by Refinitiv
Picking up a trick from @EarningsScout, the calendar 2021 EPS for GOOGL has risen 78% since 9/30/20.
It’s clear from both tables, positive and substantial revisions are occurring for GOOGL in the last year.
Like FB, GOOGL’s price-to-cash-flow and free-cash-flow ex-cash is 21x and 29X TTM both metrics, and GOOGL at $2,700 per share sports a 3% free-cash-flow yield.
Microsoft (MSFT) also reports after the closing bell Tuesday night, October 26th, 2021.
Sell-side consensus for Microsoft per Briefing.com is expecting $2.08 in EPS on $44 billion in revenue, for expected y.y growth of 13% and 18% respectively. IBES / Refinitiv consensus is expecting $2.07 and $43.9 billion MSFT’s first fiscal quarter of ’22. Typically Softee’s first quarter of the fiscal year is the weakest.
In the June quarter, Azure revenue grew 51% y.y (that is MSFT’s cloud product 2nd in market share only to AWS or Amazon Web Services), and all three segments Productivity & Business, Intelligent Cloud, and Personal Computing, all printed revenue ahead of consensus.
Azure is driving operating margin growth at MSFT, with Intelligent Cloud operating margins increasing 600 bp’s y.y in the June qtr ’21. However Morningstar cautioned that accounting changes in fiscal ’22 could pressure some metrics.
Trading at 35x and 31x fiscal ’22 and ’23 EPS of $8.82 and $10.13 respectively, for expected growth of 9% and 15% over the next two fiscal years, MSFT is expensive on a PEG basis for sure. MSFT’s cash-flow valuation metrics (ex-cash) of 29x and 37x respectively leaves Softee a little richer than some of the other Big 5, but MSFT still sports a 3% free-cash-flow yield and cash on the balance sheet of $130 billon or 6% of MSFT’s market cap as of June 30, likely stimulated the $60 billion share repurchase announcement on September 16, 2021.
In fiscal ’21 just ended 6/30/21, MSFT grew EPS 40% y.y and revenue grew 18%.
EPS and revenue estimate revisions:
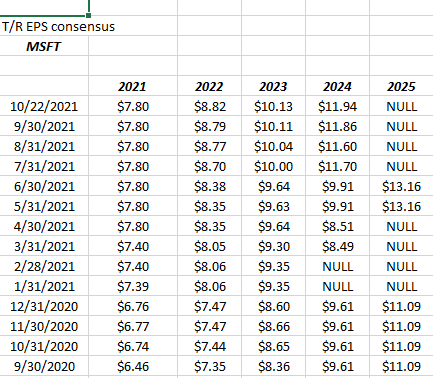
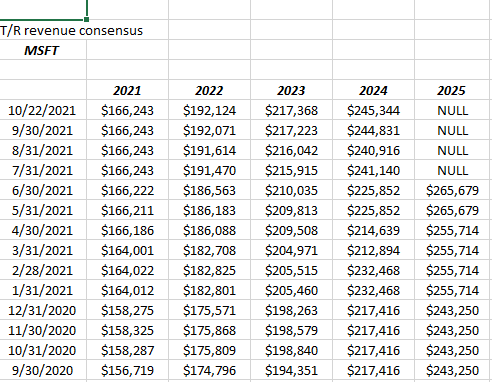
Data sources from IBES data by Refinitiv
It’s tough to tell whether the fiscal 2022 EPS estimate of $8.82 which has only increased since 9/30/21 by 20% is being impacted by accounting changes or MSFT is actually experiencing slower growth post the pandemic pop. It’s probably a combination of both since analysts seem cautious around mega-cap tech into calendar, 2022.
Technically, MSFT made a new all-time-high in the last 10 days, trading above it’s $305.84 all-time-high from late August ’21.
Amazon (AMZN) reports their 3rd quarter, Thursday, October 28th, 2021 after the closing bell.
There’s a couple things that worry about me about Amazon, the first being the departure or ascension of Jeff Bezos to “executive chair” of Amazon as Andy Jassy the former head of AWS, is the new Amazon CEO. Does Jeff think Amazon’s growth is over and wants to step aside to avoid the inevitable decline that all companies eventually see or does he really want to focus on “early initiatives” ? The Amazon GO concept has never really gotten off the ground as Bezos had hoped and it’s been an Amazon “concept” since 2014. Also from the press it’s clear Jeff wants to be involved with Blue Origin, the space company he founded.
The other thing that worries me about Amazon is that it seems like everyone is bullish the stock. Only Credit Suisse has come out with cautious comments before Thursday’s report lowering their price target from $4,700 to $4,200, thanks to wage hikes and “global logistics headwinds”.
Seriously, while the bears have been banging the valuation for 11 years and watching the stock trade from $125 to $3,300, the fundamental bulls have nary a negative comment for Amazon, (for good reason). I just can’t help but think, “When do we see peak Amazon ?”
Current sell-side consensus per IBES / Refinitiv, for Amazon’s September ’21 quarter is $8.91 for $111.5 billion in revenue for an expected decline EPS of 28%, on 16% revenue growth. To be clear to readers Amazon is one of it’s classic “investment phases” which have occurred periodically in the last 11 years and have resulted in investors stepping on the stock. However once the investment phase ends, the history has been that Amazon sees significant delta to their EPS after these periods and shareholders would have been better served to stay invested.
AMZN EPS and revenue revisions:
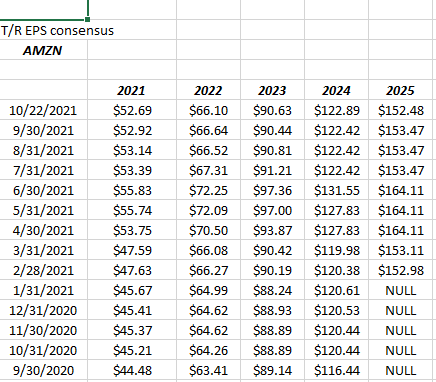
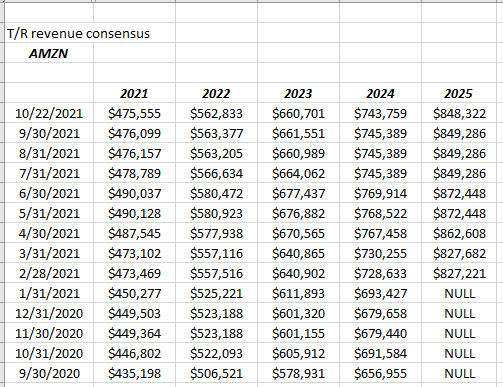
Data sourced from IBES / Refinitiv
There is no question that AMZN’s positive EPS and revenue revisions have been tempered for the time being, and the revisions since late July ’21 could be described as more flat or “unch’ed” given the magnitude of the upside revisions in 2020.
Amazon at $3,200 – $3,300 per share is trading at 60x and 53x 2021 and 2022 expected EPS of $52.69 and $66.10, which is expected y.y growth of 16% and 25% respectively. Amazon is trading at 28x cash-flow (ex-cash) and 382x free-cash-flow thanks to the soaring level of “capex” we’ve seen in the last 6 quarters. Since December ’19 Amazon’s TTM (trailing twelve months) capex has soared from $16.9 billion to $54.7 billion as of the June ’21 quarter, and the free-cash-flow valuation has fallen from 46x to the June quarter’s 382x.
The real risk for AMZN is that one of these investment periods lays an egg and AMZN not only doesn’t get the earnings delta but free-cash-flow never recovers. Amazon is expected to generate $475 billion in revenue in 2021 and free-cash-flow was negative in the June ’21 quarter.
Technically, Amazon has traded roughly flat since September 1, 2020, so the stock has been in a corrective mode for 13 months consistent with the above trend in EPS and revenue estimates. Amazon has been riding it’s 200-day moving average for the 2nd half of 2021, trading above and below it for limited periods of time.
Apple (AAPL) like Amazon is expected to report after the closing bell on Thursday, October 28, 2021.
Sell-side consensus for the tech giant for their fiscal Q4 ’21 earnings release is expecting $1.24 in EPS on $84.8 billion in revenue for expected growth of 70% and 31% respectively. For full-year fiscal ’21 Apple is expected to grow EPS 71% and revenue 33%. The shocking thing is – where’s what Apple’s next 3 years growth rates look like, given current consensus:
- 2022: 1% EPS growth and 4% revenue growth;
- 2023: 5% EPS growth and 5% revenue growth;
- 2024: 6% EPS growth and 6% revenue growth;
Source data: IBES data by Refinitiv
Seriously, given current consensus that’s what the next 36 months looks like for Apple in terms of EPS and revenue growth.
Trading at 27x and 26x, expected ’21 and ’22 EPS of 71% and 1%, the consensus estimates are truly bizarre. At 22x and 24x cash-flow and free-cash (ex cash), Apple is the cheapest name of the Big 5 and sports a 4% free-cash-flow yield.
Here is Apple’s EPS / revenue consensus revisions:
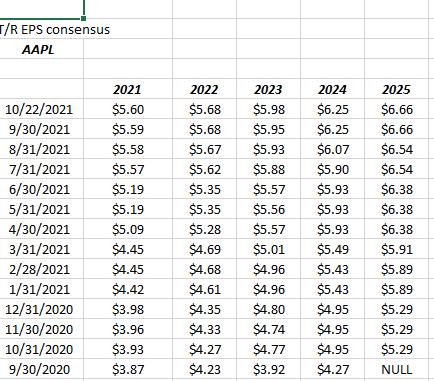
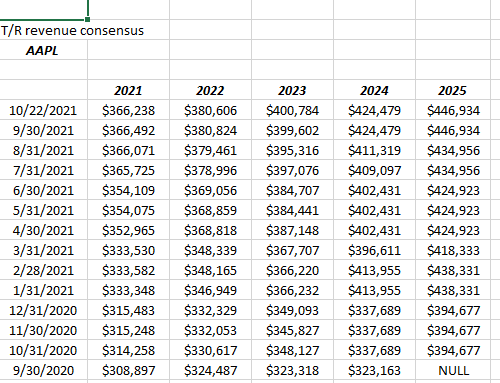
Source data: IBES data by Refinitiv
Again, using the @earningsscout trick, the Apple consensus EPS and revenue estimate for fiscal ’21 have risen 44% and 17% respectively since 9/30/20.
It’s interesting to me that Apple’s valuation and rating at Morningstar still sports a “narrow moat”. That deserves a longer article and it likely has to do with Apple and iPhone being hardware technology.
Rankings:
’21 expected EPS growth:
- Facebook: 40%
- Google: 72%
- Microsoft: 9% (fiscal ’22 started July 1 ’21)
- Amazon: 16%
- Apple: 71%
’22 expected EPS growth
- Facebook: 13%
- Google 5%
- Microsoft: 15% (really fiscal ’23)
- Amazon: 25%
- Apple: 1%
’21 expected revenue gro:
- Facebook: 42%
- Google: 39%
- Microsoft: 14%
- Amazon: 23%
- Apple: 33%
’22 expected revenue gro:
- Facebook: 19%
- Google: 17%
- Microsoft: 13%
- Amazon: 18%
- Apple: 4%
Current Cash-flow valuation (ex-cash):
- Facebook: 19x
- Google: 21x
- Microsoft: 29x
- Amazon: 28x
- Apple: 22x
Current free-cash-flow yield:
- Facebook: 3%
- Google: 3%
- Microsoft: 3%
- Amazon: 0%
- Apple: 4%
Summary / conclusion: Looking at all the data above, Facebook is probably the cheapest on a relative basis given the sentiment around the stock and the valuation metrics, while Apple remains the cheapest of the Big 5 on an absolute valuation basis. Amazon is giving me the most anxiety even though revenue growth looks good since margins are being squeezed and the “capex” is enormous thanks to another “investment period”.
One this in clear: the sell-side consensus is expecting a mediocre 2022 in terms of EPS growth for just about every company except Microsoft and MSFT’s ’21 estimate which is really fiscal ’22 could be depressed thanks to accounting treatment.
Writing this analysis leaves me with the impression there is a lot of skepticism baked into the “Big 5” EPS and revenue estimates already.
However for Q4 ’20 and Q1 ’21 – when I look over the spreadsheets – turned out to be huge quarters for many of the mega-cap tech giants. The Big 5 still face tough comp’s through the March ’22 quarter.
The one unambiguous aspect to SP 500 earnings since June ’20 was how badly sell-side consensus underestimated EPS growth. That could be the same for mega-cap tech for ’21 and ’22.
It will be interesting to see the revisions for ’22 after the earnings reports this week.
Lots of geeky data. Sorry for the math rush but it’s part of the process.
None of this is advice, please. Microsoft and Amazon remain two of client’s Top 10 holdings on a firm-wide level. Clients have smaller positions in Facebook, Apple while Google – thanks to appreciation – has found it’s way into the client top 10 positions.
This could all change tomorrow, too. Take everything you read with great skepticism.
Thanks for reading.