Great post by Michael Batnick and Josh Brown’s group over at Ritholtz that hit the wires Sunday, with the topic being individual investors elevated expectations about future returns.
There is a few graphs on the 11 minute podcast but the upshot is that – according to the survey – investors are expecting 17.5% “real” returns in the US stock market going forward.
For some perspective, here is a return chart of the SP 500 (including the dividend reinvested), from 1/1/2000:
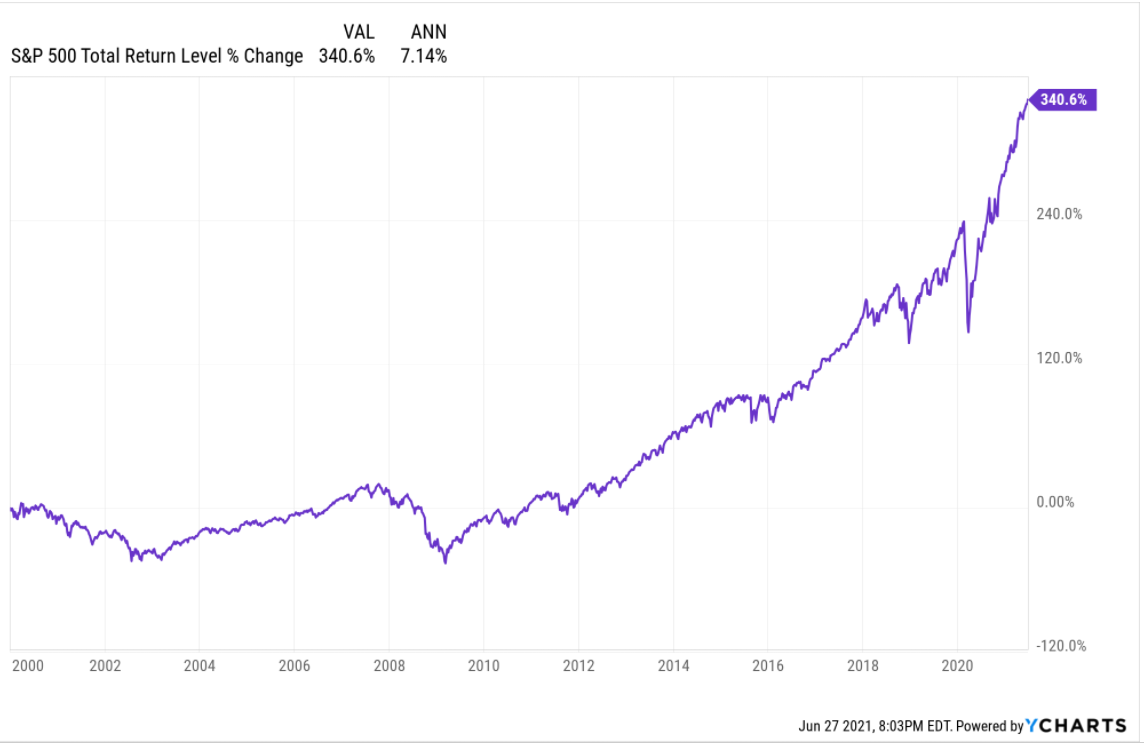
The “average, annual” return for the SP 500 over the last 20.5 years is precisely 7.14% per year.
That’s actually right in line with the long-term, post WW II average for broader market equity returns the last 70 years.
If we look at shorter time frames for the SP 500:
- 1/1/2000 – 6/25.21: +7.14%
- 1/1/2010 – 6/25/21: +14.72%
- 1/1/2015 – 6/25/21: +14.17%
Coming into 2021, in an end-of-year or beginning of year blogpost, I was worried about the cumulative returns on the Nasdaq on the SP 500 since 1/1/2019. Remember Jay Powell softened his views on monetary policy in Christmas week, December, 2018, and then the SP 500 took off. Here are the two year “cumulative” returns for the SP 500 and the Nasdaq:
1/1/2019 – 12/31/20:
- SP 500: +55.68%
- Nasdaq: +103.4%
I’m still worried about 2021 given that the month of January ’21 had a negative return. Remember the old market maxim about January’s: “as January goes, so goes the market.”
Summary / conclusion: Long-term SP 500 returns are just about average, while it’s safe to say that over the near-term, retail investors might have elevated expectations. The survey quoted by Josh and the team distinguishes between individual and institutional investors so the problem lies with retail investors.
While doing performance meetings with clients, on occasion, I will ask them what they thought the Sp 500 or the Nasdaq returned in a given period, just to see how closely they pay attention, and the answers can be wildly disparate from actual returns. It really depends on the headlines over the last 30 – 60 days.
My guess is most clients don’t know that the “average, annual” return for the SP 500 post WW II is 7%.
With 14% – 15% average, annual returns for the shorter timeframe, you could make the case that returns are elevated, but remember the QQQ averaged about 37% – 38% per year, while the SP 500 averaged 25% per year from January, 1995 to December, 1999.
Anyway, more good work from Michael Batnick, author of Irrelevant Investor, which prompted a longer blog post around that survey.
Thanks for reading.