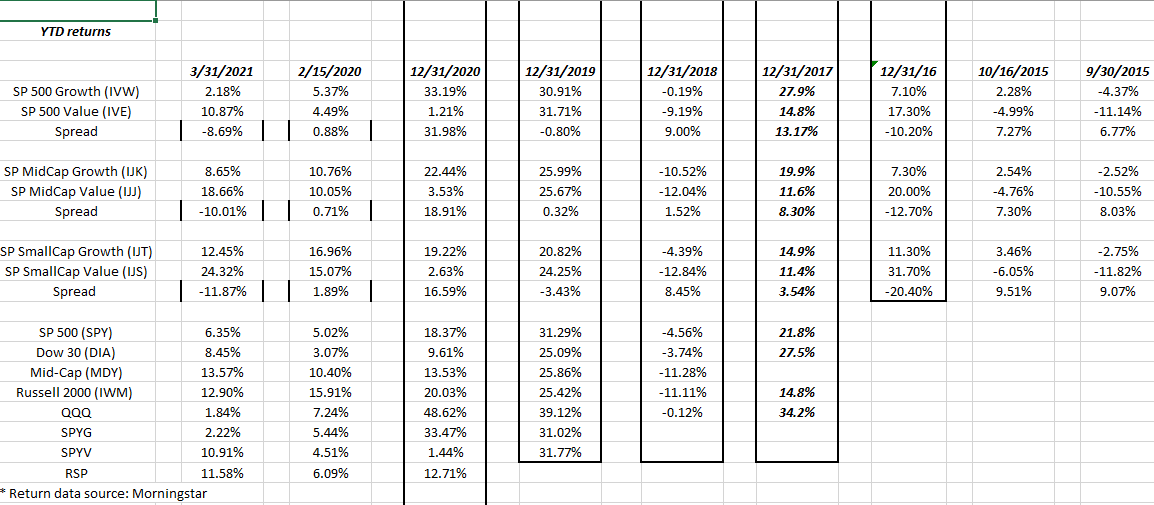
Source: internal spreadsheet updated every 6 weeks or 2x a quarter.
Value has underperformed Growth since 2016 as readers can see from the above s/sheet, which was a duration similar to the late 1990’s in terms of length.
However, that started to change in the 4th quarter of last year, and you can see the sharp outperformance by “value” across all market caps in q1 ’21.
The key question is – “Does the value outperformance continue ?”
Not shown in the above ETF detail is the Russell 1000 Growth vs Russell 1000 Value for Q1 ’21:
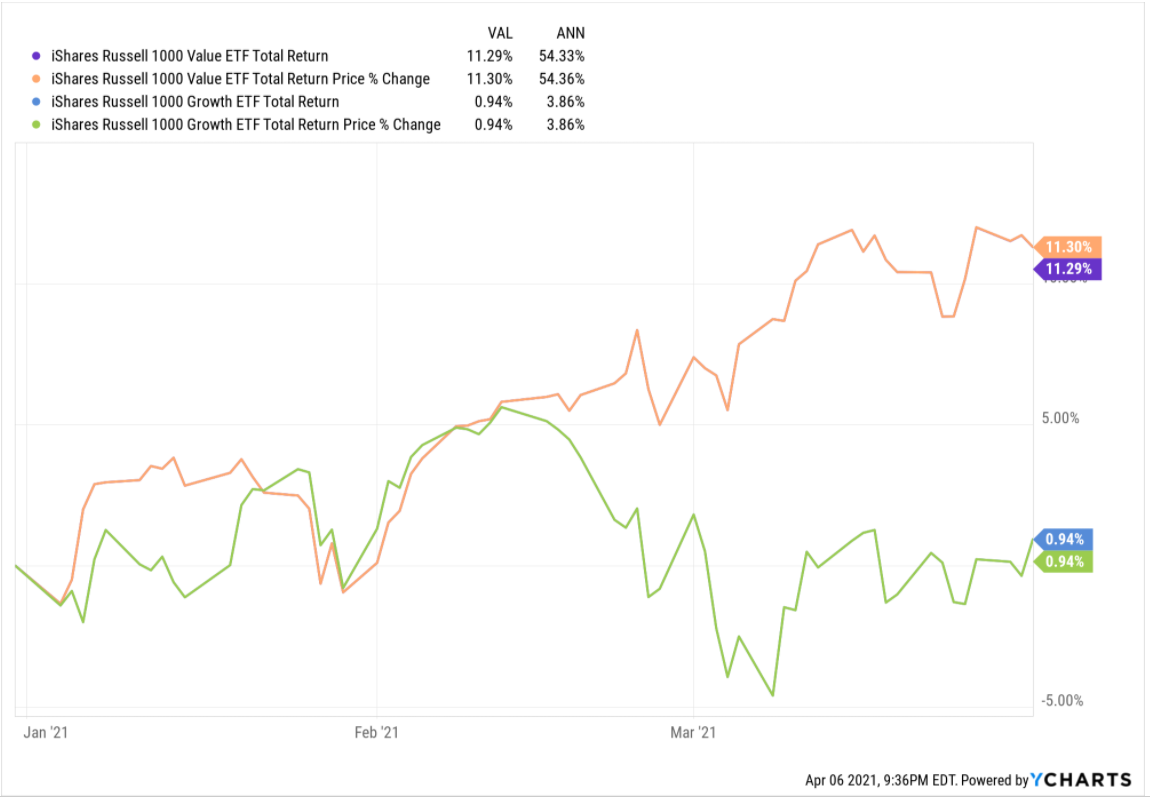
This chart from Ycharts shows the dramatic outperformance of Value in q1 ’21, within the Russell 1000, a tech-heavy index, where Tech has a 40% weight.
Financials is a sector that will likely continue to work higher, although higher rates and a steeper yield curve clearly help.

This clear breakout on the XLF is a 13-year consolidation at an end. The KRE or regional bank ETF (chart not shown) actually hit a new all-time-high in 2018 and is testing the $65 – $66 level again. Energy and Basic Materials should probably be folded into one sector given their respective market-cap weights.
Similar to what happened in 2000 – 2003, value has quickly become momentum, while momentum – like large-cap tech – is starting to look “value-like” on a relative PE and cash-flow basis.
Scary stats (or data of which I take notice):
- Cumulative 2-yr total return of the SP 500 from 01/01/2019 to 12/31/20: +55%
- Cumulative 2-yr total return of the Nasdaq 100 from 1/1/2019 to 12/31/20: +107.6%
Is it any wonder that large-cap Tech, growth, and /or momentum need a break ?
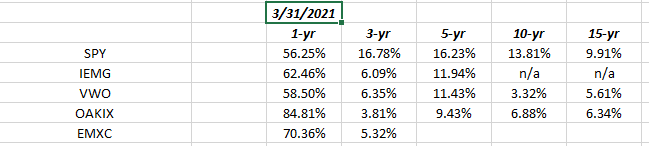
1 and 3-yr returns SPY versus EM ETF’s:
Be sure and click on the spreadsheet to expand it.
Look at the one-year returns versus the pandemic lows (almost) for the SPY versus some of the Emerging Market ETF’s.
If you are looking for a case to overweight Emerging Markets and International, this data set is it. Look at the 3-yr, 5-yr and 10-yr returns of the SP 500 versus the VWO and particularly the 3-year and 10-year “average, annual” return differences between the two.
The dollar has been stronger this year, so that’s held back the VWO, EEM and the IEMG but even with the stronger dollar, the VWO returned 4% in q1 ’21 versus the 6% return on the SP 500. I’ll take that 2% differential in a long-out-of-favor asset class.
EM and International (mainly through the Oakmark International or OAKIX fund) have been lifted to between 10% – 20% of client accounts. Admittedly, I was way too early on EM – started buying in Q1 ’16 after the first crude oil crash, but it was less than a 5% weight through mid-’18 – but have steadily added to the VWO over time, as well as OAKIX and the GBFAX (VanEck EM fund.)
Just copied and pasted from Howard Lindzon’s blog the following charts show exactly how this blog is thinking about Financials and Europe:
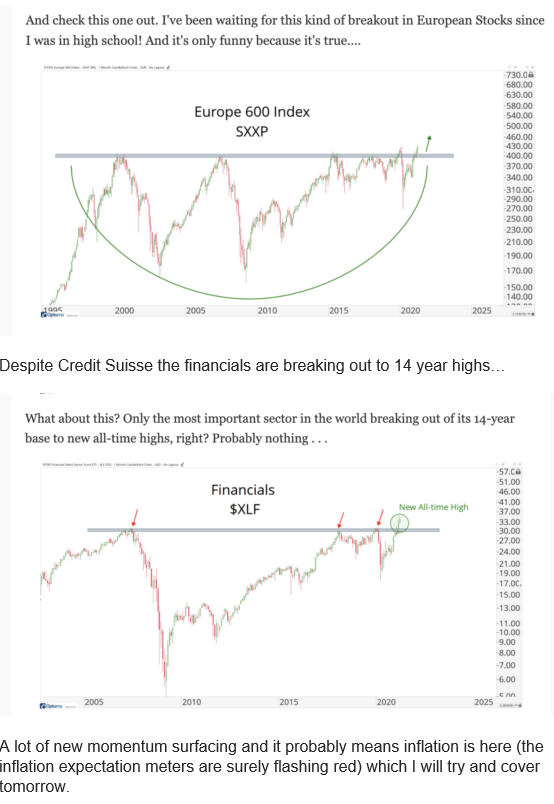
Chart source: Howard Lindzon’s daily blog
From a portfolio construction standpoint the EM positions represent “value” or the non-momentum aspect of client accounts.
Top 10 Holdings: 3/31/21:
- Microsoft (MSFT): +6.25% YTD
- BlackRock Strategic Income (BASIX): +0.13% YTD
- Vanguard Emerging Markets (VWO): +4.01% YTD
- JP Morgan Income (JMSIX): +1.78% YTD
- Amazon (AMZN): -5% YTD
- Schwab (SCHW): +23.23% YTD
- JP Morgan (JPM): +26.51% YTD
- Tesla (TSLA): -5.35% YTD
- Oakmark International (OAKIX): +9.01%
- SP 500 Equal-Weight (RSP): 11.58%
YTD is as of 3/31/21.
Top 10 Single Equity holdings: 3/31/21
- Microsoft (MSFT): +6.25% YTD
- Vanguard Emerging mkts (VWO): +4.01% YTD
- Amazon (AMZN): -5.00% YTD
- Schwab (SCHW): +23.23% YTD
- JP Morgan (JPM): +26.5% YTD
- Tesla (TSLA): -5.35% YTD
- SP 500 Equal-weight (RSP): +11.58% YTD
- Biotech ETF (XBI): -3.62% YTD
- Nasdaq 100 (QQQ): +1.89% YTD
- Alphabet (GOOGL): +17.7% YTD
Summary / conclusion: Because all client assets are custodied at Charles Schwab, owning bitcoin exposure has not been possible. Clients have asked about it, but I have demurred and told them they were free to do this on their own. The point is I think Coinbase (COIN) and their preannouncement yesterday will allow for all traditional investors to own crypto-risk, in a traditional public common equity shares of stock. Clients have ben told Coinbase will be like owning the tollbooth, much like Visa and Mastercard (the brands within the payments system), and they get a share of what could be increasing volume in the coming years. However this won’t be a no-brainer either. It surprised me to read the Federal Reserve is now considering a “digital currency” and that the Bank of China already has one.
The point of today’s blog is that long-dormant and underperforming sectors are coming to life, much like they did from 2000 to 2007 after the collapse of the large-cap growth asset classes.
Be sure and own some value and non-momentum in your portfolios, even though large-cap growth may not be as out-of-favor as happened between 2000 and 2007.
Take all these opinions with a grain of salt and do your own homework. This blog has been reporting Top 10 holdings and Top 10 individual equity positions for the last few years since so much of the writing is focused on SP 500 earnings and what’s not working, since writing is it’s own form of research and writing forces me to stay on top of out-of-favor asset classes and securities.
Some clients own positions going back to the late 1990’s and they are perfectly fine with that kind of holding period.
Evaluate all blogs and writings in light of your own financial position and risk profile and emotional reaction around market volatility.
Thanks for reading.