Last week, this blog wrote about the upward revisions in Tech sector EPS estimates.
As of Friday, March 19th, 2021, Technology was 26.4% of the SP 500’s market cap.
While Apple’s market cap weight as of Friday, March 19th, 2021 was 5.76% of the SP 500, the stock’s “earnings weight” was 30.2% of the Tech sector.
TJ Dhillon of Refinitiv sent me the following on the various tech sector earnings weights on Friday, March 19th:
Here are the top 5 Technology sector stocks by earnings weights:
| Apple Ord Shs | 30.2% |
| Microsoft Ord Shs | 17.2% |
| Intel Corporation Ord Shs | 6.9% |
| Cisco Systems Ord Shs | 3.8% |
| Qualcomm Ord Shs | 2.8% |
Source: Refinitiv
Basically, Apple and Microsoft are the Tech sector within the SP 500, with 11% of the market cap and 47% of the Tech sector’s earnings weight.
Here is Apple’s EPS revisions since late 2019:
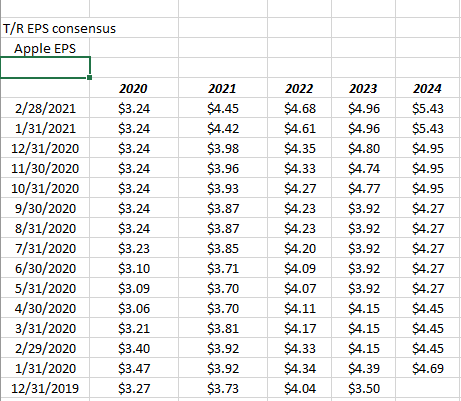
Source: IBES data by Refinitiv as of 3/21/21
Here is Apple’s revenue revisions:
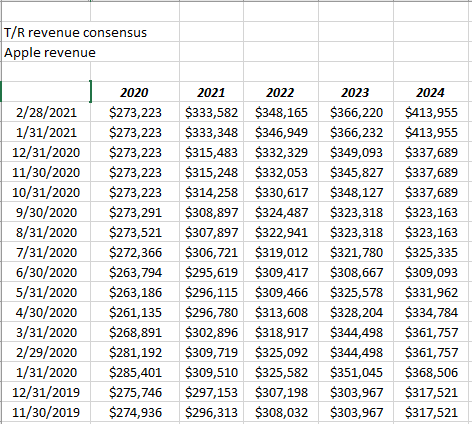
Source: IBES data by Refinitiv
The data points that caught my eye were the change in Apple’s EPS estimates from Sept. 2023 to October, 2023. Same with fiscal ’24 too. That’s a 22% jump, and my guess is that’s the next iPhone iteration. Looking at Apple’s revenue estimates for the same periods, revenue is expected to increase just 8%, which isn’t to bad for a company with a $2 trillion market cap currently.
Let’s look at Microsoft’s EPS and revenue revisions:
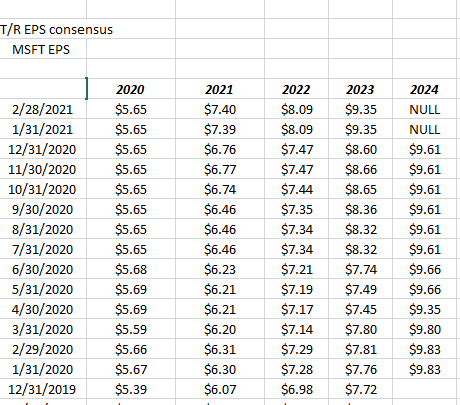
Source: IBES data by Refinitiv March 21, 2021
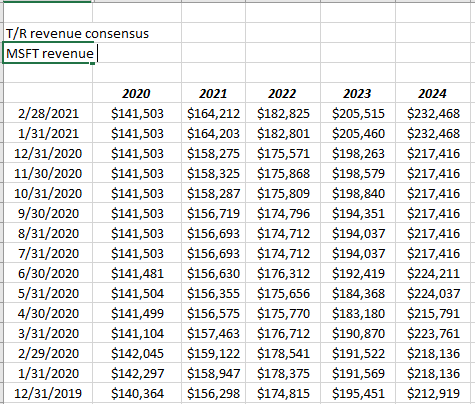
Source: IBES data by Refinitiv March 21, 2021
The one EPS data point that caught my eye is that Microsoft’s fiscal ’21 EPS revisions are / were almost $1 higher as of the end of February ’21 than last summer.
Summary / conclusion: Looking at almost 50% of the earnings weight of the Tech sector, and the revisions for both Apple and Microsoft, there is little ( so far) to be worried about in terms of the seeming strength of the revenue and earnings growth for either tech giant.
Here are the YTD returns for the top 5 earnings weights within the Tech sector:
- Apple: -9.03% as of 3/19/21
- Microsoft: +3.97% as of 3/19/21
- Intel: +28.74% as of 3/19/21
- Cisco: +9.94% as of 3/19/21
- Qualcomm: -14.41% as of 3/19/21
The underperformance of Apple and Microsoft and the outperformance of Intel and Cisco has little to do with fundamentals and everything to do with the shift in the market from growth to value, or momentum versus laggards.
How long does it last ? Could Apple and Microsoft start to see downward pressure on forward EPS and revenue estimates ?
Microsoft remains one of clients largest holdings as the cloud’s secular growth remains intact (thus far).
This article isn’t intended as a market opinion or any kind of recommendation for readers. The goal was to simply point out the difference between market cap weight and earnings weight for the tech sector and provide some color on earnings weights within the tech sector.
The goal this week is to look at some other sectors too, if nothing else comes up.
Thanks for reading.