With Joe Biden being declared the 46th President of the United States as this blog update was being put to paper, history is being written on this weekend, with a number of “first’s” for the ticket. However given the election fatigue and the fact readers can get political news almost anywhere, that’s all that will be said about it.
The SP 500 earnings data (compliments of IBES data by Refinitiv), continues to show positive revisions to forward estimates, which is most unusual in my 10 years of updating this earnings data each weekend. Normally when a new quarter starts in more or less “normal markets” the “forward 4-quarter estimate” is at its highest in the first few weeks of the quarter as the new quarter gets tacked on and the last quarter falls off. This “quarterly bump” helps investors understand that SP 500 earnings and the SP 500 market action is much more than the present quarters metrics.
This weekend’s update:
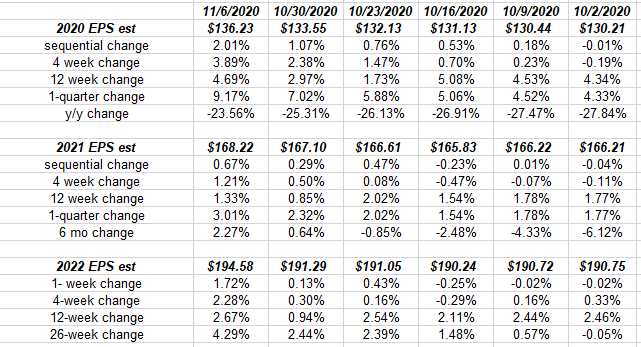
This is a simple cut-and-paste from our Excel spreadsheet that tracks “bottom-up” SP 500 EPS estimates. I have 10 years of this chronological data, (sourced from Refinitiv) but just look at the change since October 2nd for 2020 – 2022 “expected” SP 500 EPS estimates for each year.
For comparative purposes look at the exact same week, exactly one year ago:
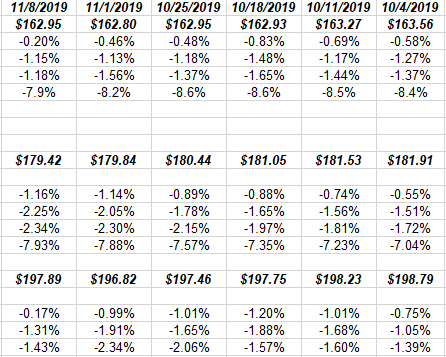
Readers can see how in “normal” times the trend in bottom-up and even “forward 4-quarter” estimates is downward. Last year at this time, Covid-19 was unknown, the economy was chugging along at a 2.75% rate, the unemployment rate was 3.5% and 2020 seemed like it was going to be a good year.
But look at the trend in the EPS estimates – that’s the normal pattern. (The calendar year was accidentally omitted: the $162 – $163 estimate was “expected 2020” at this time last year, $181 to $179 was the expected 2021 SP 500 EPS estimate and $197 – $198, was the expected 2022 SP 500 EPS estimate.
Does the 2020 Presidential election results change any of this ? Possibly. We’ll keep you updated.
Forward SP 500 EPS curve:
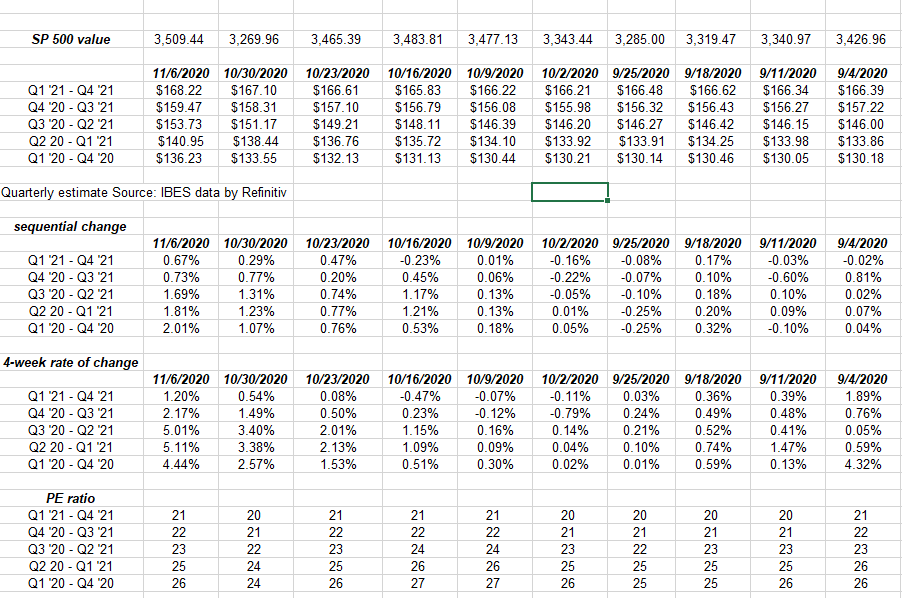
Note the 4-week rate-of-change. It’s accelerating.
Expected SP 500 EPS Growth Rates for Q4 ’20 and early ’21:
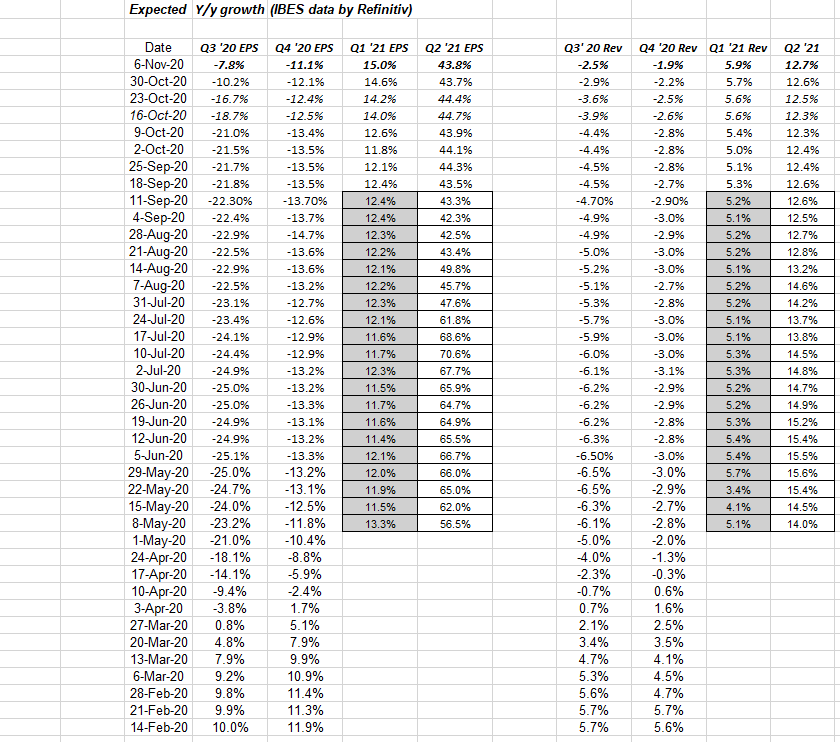
Note the continued improvement in estimated SP 500 revenue and EPS growth rates over the next 4 quarters. That’s important. (In my opinion, this is the best table we publish, repackaging the IBES data by Refinitiv into a chronological format so readers can see trends.)
Summary / conclusion: Anytime there is interesting price action across any market – and this week it was the 1% daily increase in the SP 500 from Monday to Thursday – the “narrative” floated by an endless number of voices tries to explain the action.
This week it was “gridlock” which is certainly possible, although the Georgia runoff of two open US Senate seats might complicate the demise of the “Blue Wave” theory.
SP 500 earnings “revisions” look great. They continue to trek higher. Let’s see if the 2021 estimates change as the Biden Cabinet takes shape and we start to hear what a Biden Administration might look like.
Take everything you read here with substantial skepticism. The patterns and trends can change quickly, and SP 500 earnings data can change quickly as we saw with Covid-19. Markets change even more quickly.
Seriously, for the last two months, every week I could update this blog with the headline “No Change to Positive Revisions” and leave it at that. However doing the blog, forces me to crunch and repackage the numbers.
SP 500 earnings and revenue data has been a consistently positive story.
Thanks for reading.