Jeff Miller, over at A Dash of Insight, posted this missive (www.dashofinsight.com/weighing-the-week-ahead-should-investors-change-course-because-of-the-potus-diagnosis/) this weekend questioning whether investors should chance course over the President’s Covid-19 diagnosis ? (The blog is currently under reconstruction, so the “link” function isn’t working properly. This will all get worked out shortly.)
The other question asked in Jeff’s piece this weekend, found lower in the article is what is the penchant for violence given the increasing tension over the Presidential election and the first debate ? Per Jeff’s source, quoted in the article, the risk remains low of post-election violence. Jeff also takes readers through a number of post-election scenarios. The article is well worth the read.
There seem to many different types of risks developing around the Presidential election: the risk of an undecided outcome like Bush v. Gore in November, 2000 where – per a Bespoke missive – the SP 500 fell 5% prior to the Supreme Court ruling for Bush 43. However the mitigating circumstance in that election was that the Nasdaq and large-cap tech stocks had begun to unravel prior to the election. The point being the “attribution” around the 5% SP 500 correction in November, 2000, could be partly politics and partly fundamentals.
My own best memory of that time was Cisco’s earnings report and conference call shortly after the Presidential election in November, 2000, where John Chambers raised Cisco guidance on the call, the stock rallied for day or two and then promptly turned south. John Chambers had to retract that positive guidance in the February ’01 conference call and in fact lowered guidance, but by that time the wheels were coming off the cart in terms of the large-cap growth and tech stock trade.
Remember, the stock market is the best leading indicator you / we have as investors. Don’t ignore “the message of the markets”.
Long-Term Returns for the SP 500
There was very little push-back received on this recent (https://fundamentalis.com/?p=10706) blog post where “average, annual” returns. I took a look at various long-term returns for the SP 500 showing how in the near-term the SP 500 looks overvalued while the “average, annual” return from January 1 ,2000 and even January 1, 1990, show that annual returns remain well below the long-term SP 500 average of 11% – 12%.
Maybe Paul Hickey is reading this blog, since this weekend in the excellent weekly Bespoke Report (dated October 2nd, 2020) Paul noted the following regarding annual returns for the SP 500:
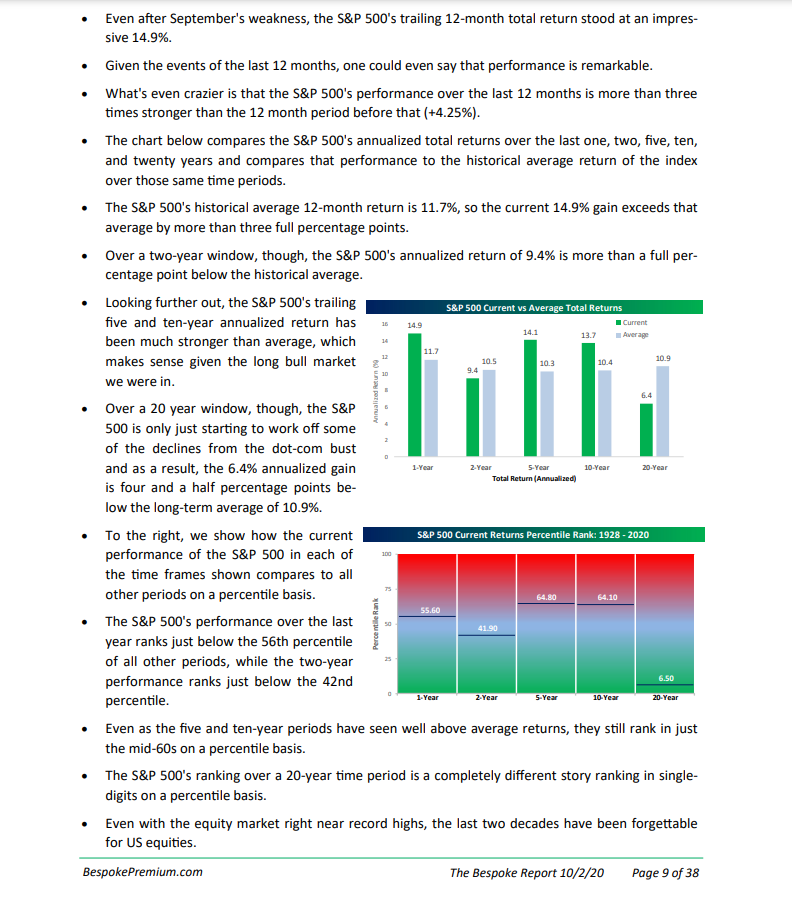
Readers could make a good case for the near-term overvaluation of the SP 500 and a better case for how the SP 500 could see a 10% – 15% correction, but looking at the longer-run SP 500 “average” returns, and referencing the Ibbotson SBBI (Stocks, Bonds, Bills, Inflation data) historical long-run average return on the SP 500 of 11% – 12%, eventually a decent bid should materialize for large-cap stocks.
The Financial Sector: Value or Value-Trap ?
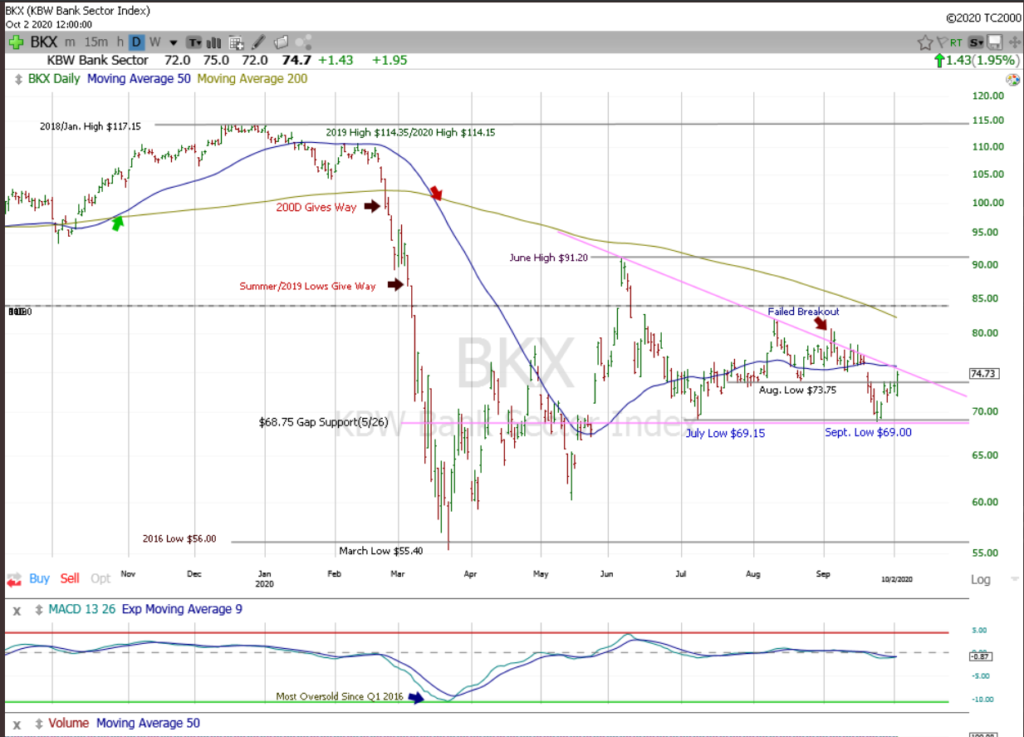
Gary Morrow, an excellent technician found on Twitter (@garysmorrow) and This Week on Wall Street put the above chart up last Friday, October 2nd, 2020.
Financials are the 2nd worst performing sector year-to-date, down 21%, exceeded only by Energy’s YTD return of -48%. (Return source: JP Morgan’s Guide to the Market.)
Personally, I still think Financials in general and bank stocks in particular are more “value” than “value-trap” but more patience will be required.
Last week, the Fed stated that they are still prohibiting stock repurchases through the 4th quarter of 2020, in order to insure that banks maintain the appropriate capital positions as the pandemic and the various shutdowns continue to impact small business.
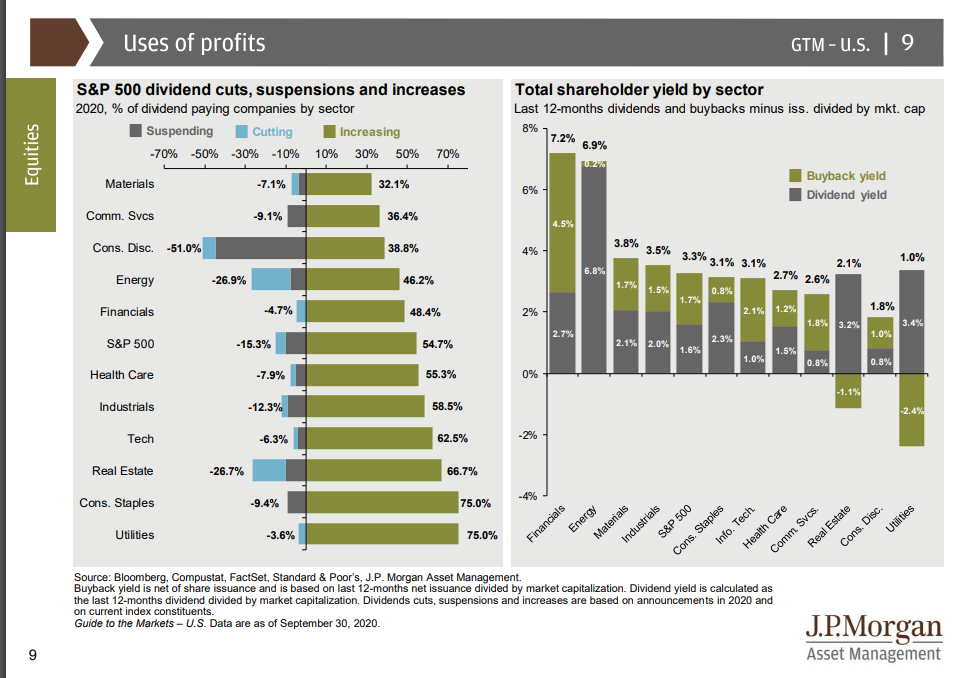
Here is a chart / table from page 9 of the latest JP Morgan “Guide to the Market” published October 2nd, 2020, and you can see from the bar chart on the right that the Financial sector’s “buyback yield” is the greatest of the 11 SP 500 sectors.
What complicates the picture is that expected consumer credit losses for the 3rd quarter. which could be greater than the first or second quarter, will be revealed starting next week, October 12th as the big banks and financials start to report their 3rd quarter earnings.
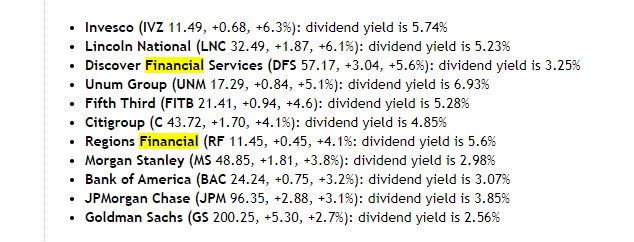
What’s interesting about this list from Breifing.com, which published this selection of names last Monday, September 28th, 2020, is that the dividend yields are quite healthy and well above Treasury and even corporate bond yields.
This blog is not typically insurance company investors but we do own JP Morgan, and Schwab as Top 10 positions (https://fundamentalis.com/?p=10721), as well as some Bank of America, but as a smaller weight.
In the coming 3rd quarter earnings releases for banks and Financials, the key metric to watch will be credit losses at the consumer level and whether the expected losses for 2020 expand further. The fact that Congress is dragging their feet on further stimulus will likely have some impact on 3rd quarter consumer loan losses.
The net interest margin contraction that began for the banks in March ’20, has mostly worked it’s way through the system. We’d need to see yield curve steepening to start to fix this margin pressure and it would likely have to last a few quarters.
Summary / Conclusion: It’s another dry week for SP 500 earnings releases, but the fireworks really start once again the week of October 12th, 2020 with when the big banks and many Financial companies kick off 3rd quarter earnings.
The Nasdaq 100 (QQQ) ended last week sitting right on top of it’s 50-day moving average.
Thinking about longer-term SP 500 returns, the penchant is to be bearish given the 5-month rally from late March to late August ’20, but looking at longer-term returns, particularly the 20-year and 30-year “average, annual” SP 500 return, the actual returns remain below the long-term averages.
Higher interest rates could fix that in a hurry, meaning any increase in the 10-year Treasury yield would likely keep a lid on SP 500 returns for the intermediate future.
Individual investors tend to forget the Fed only has direct control over the fed funds rate, while market forces determine the yields across the rest of the Treasury yield curve.
According to the data tracking done for this blog, the “10-yr Treasury yield – 30-year Treasury yield” spread ended 2020 at it’s highest spread of 79 basis points. (Week ending spread that is).
Taking everything you read here with a substantial grain of salt, and with great skepticism. One thing about capital markets, they can change in a hurry.
Thanks for reading.