Almost a month ago this chart (https://fundamentalis.com/?p=10598) was posted. and what got my attention after the article was posted was the “average, annual return” for large-cap stocks, from 1916 – 2019.
For 94 years, the “average, annual” return for large-cap stocks, which per the Ibbotson data is the SP 500, is above 10%, and probably closer to 12%.
Here is the “average, annual” return for the SP 500 since January 1, 2020.
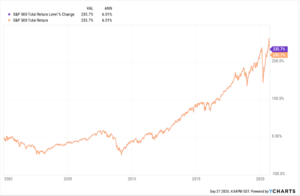
This graph from YCharts shows the “average, annual” return for the SP 500 since the turn of this century, is just over 6%, still well shy of the long-run average.
To play with the numbers a little, here are the “average, annual” SP 500 returns for various time periods the last 30 years:
- March ’09 low: +17.10%
- 1/1/2010: +12.93%
- 1/1/2015: +10.78%
- 10/23/2007: +8.45%
- 01/01/1990: +9.83%
The only return period that matched or roughly approximates the 103 year average, annual return for the SP 500 is the decade from 1/1/2010 to 12/31/2019, and obviously from the March 9, 2009 low/
Even the return from 1/1/1990, which was roughly the start of Gulf War I, is still just under 10% per year.
What struck me about all this was that readers could be very bullish or even bearish depending on your starting date for the return calculation.
It’s shocking to me that since January 1, 1990, the average, annual return is still under 10%.
————–
High-yield had a tough week
The HYG was down 1.59% on the week, and down -2.27% for one month.
The pullback in the SP 500 and the Nasdaq hasn’t made everyone universally bearish or that nervous yet, BUT you don’t want to see corporate high-yield get much worse in terms of return.
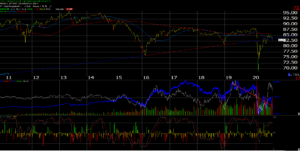
Notice how the HYG has slipped below the upward-sloping trend line.
That’s got my attention.
——————
Many of the major Financial stocks report the week of October 5th, or within the next two weeks.
Many value investors are lumping Financials in with Energy, which I find hard to believe.
The net interest income pressure won’t subside for a while, and credit losses are still in flux, but the lack of a second stimulus package will only make the credit loss guidance more onerous, thus the only positive that can be contemplated for Financial stocks is the buyback programs, which is HUGE for the sector, but will likely remain on hold given the expected credit losses.
Inflation worries could steepen the yield curve quickly, even as the Fed remains on hold with fed funds. That would likely put a bid into Financials quickly, but listening to BlackRock’s Rick Rieder on Thursday morning, Rick remained quite sanguine on the outlook for inflation:
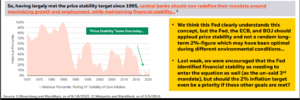
This page 11 clip from the monthly Rick Rieder’s monthly call, shows the rolling 5-year volatility of core inflation and while it looks to be rising in 2020, Blackrock thinks “price stability” looks fine today,
A second stimulus program could help expected credit losses within the banking system, but I think that is asking a lot given the environment.
If readers have access to a BlackRock wholesaler, the monthly Rick Rieder call is a phenomenal hour if you’re a data geek like me. Even after all the success he has achieved, Rick Rieder still gets excited about the data, and the story the data is telling for investors. It’s great to see an old warhorse still get excited about Fed, and capital markets research and data.
Thanks for reading.