(Work is being done to update this blog so if it looks unusual or if there are problems publishing or reading, it’s not you, it’s me. The blog should be fully updated and user-friendly by the end of September ’20.)

Coming into Covid-19, a chunk of client bond money was in higher yielding money-markets since credit spreads (in my opinion) offered little value prior to March, ’20.
After the 35% correction in the SP 500, and upon the announcement of the Fed liquidity programs, all that money was moved into corporate credit risk ( a tactical bet) given the spread widening that happened.
The above spreadsheet was put together so i could send updates to clients and keep them informed on their bond allocations and how they are performing.
As readers can see – since May 8th or the point I could paint the spreadsheet for copying – YTD returns for these funds continue to gradually improve. Clients own all these funds although all clients don’t own all the funds, plus there is an allocation to the HYG and the SHYD.
So far, given the drawdowns in the SP 500 and the Nasdaq 100, there is little evidence of a reversal in credit markets.
This should eventually be supportive of the major equity indices as well.
———————————-
The Yin and Yang of the Nasdaq 100 and SP 500
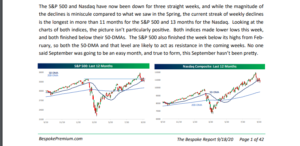
In the Bespoke Weekly Report of 9/18/20 (always a must read) the team highlights two charts and notes that the technical setup doesn’t look great.
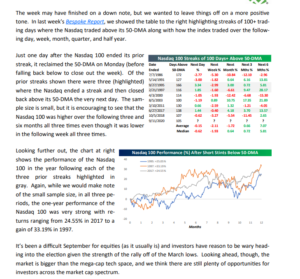
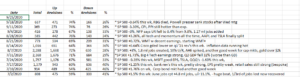
Towards the end of the Bespoke Weekly report, Bespoke notes that – despite all the glum news – that with the Nasdaq streak above its 50-day moving average of 100+ trading days, the track record of positive returns 1, 3, and 6 months down the road is still enviable. The average 6-month return averaged 7%.
The average 1-month return is negative, while the average 3-month return is positive, which wouldn’t be inconsistent with what is being seen today.
————————
SP 500 Estimate Revisions Remain Positive:
One way used to verify the weekly tracking of bottom-up and top-down SP 500 EPS estimates is to track the positive / negative revisions as published by IBES data by Refinitiv.
The above spreadsheet goes all the way back to 2012, and maybe even further.
As readers can see, given what was written yesterday, the “aggregate estimates and revisions” as published by Refinitiv supports the sequential revisions being seen in the core data.
There continues to be upward pressure on SP 500 EPS estimates.
Summary / conclusion: Energy was a top-performing sector this week, but the Financial sector was rather “meh”. Industrials like Caterpillar have really improved in terms of relative strength. Can’t recall the source, but Value is on track to outperform Growth for the month, for the first time in years. The question is, “Is this sustainable ?” or is it the proverbial dead-cat bounce?
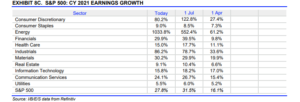
This table from Refinitiv shows the trend in 2021 sector estimates: note the improvement in Energy, Basic Materials and Industrials.
Remember these are growth rates. Energy looks huge, but the sector is losing money, and $40 – $42 in terms of crude is thought to be breakeven, hence the growth rates can distort the picture.
Consumer Discretionary will have the toughest comp’s next year with housing, auto’s, Amazon, etc.
My own opinion is 2021 estimate data will be more “investable” in December ’20 and after the election.
This is one opinion so take it with great skepticism.
Thanks for reading.