Per our technical software, the SP 500 has declined a little over 6% the last two weeks, while the QQQ has fallen a little over 7%.
The Nasdq 100 closed below 50-day moving average on Friday, September 11th, for the first time since late February, ’20.
The correction is inline (so far) with the three other draw-downs in late March, late April, and mid-June ’20.
It’s always tough to talk politics in an investing forum, but i suspect the lack of a 2nd stimulus package is a political ploy to get the economy to at least not be gaining strength prior to November 3rd, 2020.
Because so much about Covid-19 was unknown in March ’20, the first stimulus package was designed to prevent a real consumer shock to the US economy – per BlackRock – “household income” actually grew in the April through July ’20 period thanks to fiscal stimulus. This blog post from May 8th, 2020, shows the slide from one of the BlackRock conference calls detailing the gains in household income from fiscal stimulus.
By the way, this is not meant to be partisan commentary. Most readers and clients know my political leanings, but political gamesmanship is a finely-crafted art practiced by both sides.
Americans will not see a new stimulus package before the election, and it will likely impact economic data, and possibly SP 500 earnings. The weekly update in SP 500 earnings from this blog yesterday showed the “4-week rate of change” in the SP 500 forward earnings curve, was slowing. That could be a result of the lack of new stimulus. The “4-week rate of change” peaked the week of August 14th, 2020, two weeks after the bonus unemployment payment ended. ( To be fair with readers, “correlation is not always causality” and the fact that the 4-week rate of change peaked might not be related to the end of the bonus unemployment. The peak also coincided with the middle of the quarter and the weakening could be simply analysts are turning more cautious as the end of quarter approaches as they typically do.)
The endless (and often mindless) Bull vs Bear debate:
The two market metrics which i watch closely (outside of SP 500 earnings) are market breadth and market sentiment:
——————–
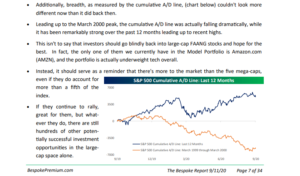
This breadth chart from Bespoke’s Weekly Review from 9/11/20, shows a comparison of market breadth between March 2000 (bottom line), and the current market (blue line on top) and readers can see “breadth” today remains in far better shape than in late 1999, early 2000.
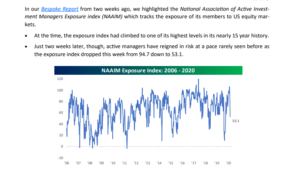
A sharp drop in sentiment measures has been a hallmark of this bull market since the lows in March, 2009. The NAAIM (National Association of Active Investment Managers) index showed a remarkable drop in bullish sentiment this week, falling from 93.7 to 53.1 which is a remarkable 40.6 point drop in the index.
—————————
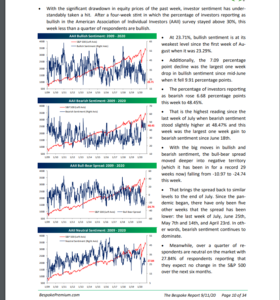
This Bespoke summary of the AAII (American Association of Individual Investors) sentiment index shows that – like the NAAIM data – bullish sentiment fell of a cliff this week and bearish sentiment rose sharply.
My impression is that AAII data has been bearish for the last 10 years so it’s good to see Bespoke adding other sentiment measures to get a better gauge of true investor sentiment.
The very low level of the put / call ratio the last two months has been worrisome, and even with the recent weakness in large-cap growth stocks, the put/call ratio still reflects extreme bullishness.
One more chart on sentiment:
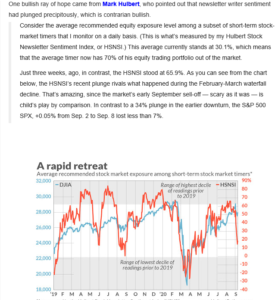
Pulled from Cam Hui’s “Humble Student of the Markets Blog” Cam pulled Mark Hulbert’s blog, and Hulbert graphed and noted the sharp drop in bullish sentiment and market-timer bullishness in the last week. be sure and read the commentary above the chart, too.
The continued positive breadth and rapidly-bearish sentiment, is actually rather bullish for the market at this point.
—————————-
The Growth vs Value debate:
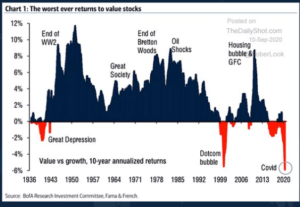
LizAnn Sonders of Charles Schwab posted the above graph to Twitter on September 10th, 2020.
On September 1, 2020, JP Morgan did a conference call featuring Jamie Steinhardt of the JP Morgan Income Fund and Doug Stewart of the JP Morgan Large-Cap Growth Fund.
During the call. Jamie Steinhardt, carrying the “Value” ball for the JP Morgan team noted the following statistics:
- As of August 31, the Russell 1000 Growth index returned 30%, versus the Russell 1000 Value’s -.85%, the widest dispersion between Value and Growth since Russell started compiling the data in 1979;
- Growth is trading at a 70% premium to Value, versus the typical 38% premium historically;
- Technology is 45% of the Growth Index versus it’s 9% weighting in the Russell Value index;
- 140 SP 500 companies remain in bear market territory;
Could the problem be with “value” rather than “growth” ?
Sitting at lunch with long-time industry friend yesterday, who is more on the marketing or client relationship side of the investing business rather than the portfolio management side, and I asked him, “Do you know what Energy’s market cap % of the SP 500 today versus say, late 2014, early 2015 ?”
He didn’t.
Energy’s market cap as a percentage of the SP 500 as of 9/11/20 was 2.2%, versus the 14% – 15% weight in late 2014, early 2015. Energy as an influence on the SP 500 has become almost non-existent. I don’t know what Energy’s market cap was in the late 1970’s, the Arab Oil Embargo was in full swing or inflation was rising at 8% per year, but the fact that it was 1/6th of the SP 500 at one point in the last 5 years and is now at 2.2% is representative of the “creative destruction of the US economy.
Financials too. Financial’s have fallen to 9.9% of the SP 500 by market cap, versus their pre-real estate spinoff weight of 20%, which would be a post-spin-off weight of roughly 17%.
(The one stat that saved clients from owning Energy of any size the last 10 years was that – per the IEA (International Energy Agency) – 50% of the demand for crude oil is driven by gasoline distillation. Think of what the electric vehicle (EV) will do to gas demand over the next 5, 10 and 20 years.)
While the world focuses on FAANG, FATMAAN and the growth side of the debate, maybe the real problem is “value”.
Maybe there isn’t much value in “value”.
The point being, maybe the ratio between the two styles is being distorted by “value” and not as much by “growth”.
Summary / conclusion: The Nasdaq 100’s close below it’s 50-day moving average on Friday, 9/11, got some attention this weekend. Last week on Tuesday, the first trading day after the Labor Day weekend, the SP 500 fell 2.78% which breaks the pattern of the Monday rallies since the March 23rd low. Usually the first trading day of every week has seen a big green day for the large-caps, but last week broke the string.
The breadth and sentiment data is bullish but even Bespoke noted that the big drop in sentiment happened in early 2007 and while the market rallied after a similar drop, a year later it was struggling.
I like to watch the high-yield market when the equity market starts to wobble a little, in particular the HYG. While the stimulus and possibly slowing earnings into next quarter’s earnings may slow the SP 500 earnings growth, the Fed stimulus remains an unambiguous positive, and the HYG, now being bought by the Fed, is one tell for the squeamish.
Fed liquidity should continue to keep a bid under credit spreads and that should keep a floor under stock prices (ultimately).
Read everything hear with great skepticism and remember it’s just one opinion. Make all decisions based on your financial condition and your own time horizon.
Thanks for reading.