First two-day vacation this weekend in – well – a while, which fortunately kept me off the blogs. Apologies for the last post.
The SP 500’s August return is the best August return since 1984 (per CNBC, and per Ryan Detrick) so even seasonal trading patterns are taking a back seat to the overwhelming liquidity and the improvement in corporate credit spreads since April, 2020.
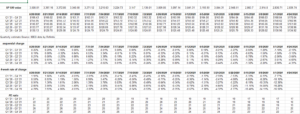
Here’s a quick update on the SP 500 EPS numbers:
Improvement in Forward 4-Qtr Estimate:

The key data point on the spreadsheet is that – since July 2nd or the start of the 3rd quarter, the SP 500 forward 4-quarter estimate has improved sequentially every week but one, or for 8 of the last nine weeks.
After the first quarter, the Street estimates for Q2 ’20 and beyond were clearly reduced too much and now the sell-side and the strategists are raising their numbers, at least for Q2 ’20.
The forward SP 500 EPS curve:
The advantage of looking at the “SP 500 EPS curve” is that with the election looming in 10 weeks, and investors wondering if they should use the calendar 2020 or calendar 2021 EPS estimates to value the SP 500, my response is use the forward earnings curve and see what the future looks like.
The dollar EPS estimate for 2020 is finally above $130, after bottoming near $124 and the SP 500 2021 EPS estimate has risen to $166 and remains above the 2019 final print of $162.
Note too the sequential and 4-weeks rates of change for the forward estimates.
(Source data: IBES data by Refinitiv)
DataTrek’s blog (cut-and-pasted below) notes that analysts have “barely touched” their Q3 and Q4 ’20 estimates:
|
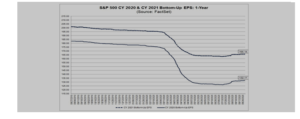
Takeaway: even with Q2’s record level of earnings outperformance relative to expectations, Wall Street analysts have barely touched their Q3/Q4 2020 estimates. Q2 ended up being $5.25/share better than what they were looking for on July 10th (just as earnings season started). Yet the Street’s estimate for all of 2020 is just $5.32/share higher than then; you can see the trough in the 2020 line above (the bottom one). Essentially, the Street has added just $0.07/share for 2H 2020 even though they were much too pessimistic about Q2.
Finally, a summary of analysts’ implied S&P 500 12-month price targets:
- If every S&P stock hit the average price target of the analysts that follow it, the index would basically be at 3,700 (FactSet’s exact number: 3,698.51). That is 5.4% above Friday’s close.
- You might think “that’s not a lot of upside”, but keep in mind that at the start of Q2 earnings season on July 10th the Street’s aggregate price target was 3,352. That represented 5.2% upside, but in the 7 weeks since then the index is up 10.1%.
(The above copy was cut-and-pasted from Datatrek Research’s blog, from the Sunday, August 30th edition. )
SP 500 earnings data by the numbers:
- Fwd 4-qtr estimates rises to $145.97 from $145.66 in the prior week
- The forward PE is 24x versus 22x at the start of the quarter
- The SP 500 “earnings yield” has fallen to 4.16% – that’s one of the lowest prints i can remember, and might indicate that forward estimates have more room to improve. (It could also mean the SP 500 needs a 5% – 10% correction to take the euphoria of the SP 500.)
- The “average” expected SP 500 EPS growth for 2020 and 2021 remains 4% for the 20th consecutive week.
Summary / conclusion: While the forward 4-quarter estimate changes and slow grind higher tells us that the sells-side is getting more optimistic about Q3 ’20 through Q2 ’21 (the forward estimate covers this period), as Datatrek points out, the improvements are still not yet material.
There is a substantial performance difference between the Top 5 – 6 names in the SP 500 (the acceleration of the digital economy so to speak), and the “recovery” stocks like airlines, gaming, retail, casino,. and even emerging markets and small-cap asset classes.
That’s where the risk is in this stock market and it’s been written about constantly for much of 2020.
Take everything you read on this blog with substantial skepticism. Do your own homework and evaluate all market commentary in light of your own financial condition and time horizon.
Thanks for reading.