From Ed Yardeni’s blog on Tuesday, 8/25:
“1) GDPNow model tracking at 25.6% for Q2. (2) Citi’s economic surprise index remains surprisingly strong. (3) US flash PMIs flashier than the ones for the Eurozone. (4) NY and Philly business surveys were solid in August. (5) Leading indicators leading higher. (6) Transportation indicators in low gear. (7) S&P 500 revenues and earnings data were down sharply during Q2. (8) Weekly forward revenues and earnings show both recovering from their recent bottoms. (9) Unlike in the movie, gold and bond prices are good friends.”
During April and May ’20, on the JP Morgan conference calls which they were offering almost daily, Dr. David Kelly said that he was expecting a 13% – 15% Q3 ’20 GDP growth rate, after the expected sharp collapse in Q2 ’20. Dr. Kelly hasn’t mentioned Q3 ’20 GDP on a call in a few weeks, so his own GDP revision might be higher now.
Ed Yardeni’s forecast is for 25.6% according to the model he cites. Employment, housing and large-cap retail have all come in hotter-than-expected in Q2 ’20.
We won’t get our first look at Q3 ’20 GDP until late October ’20, just a week or two prior to the election.
————
“Average, Annual Return”
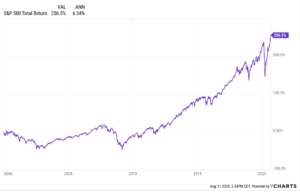
The 20-year “average, annual” return for the SP 500:
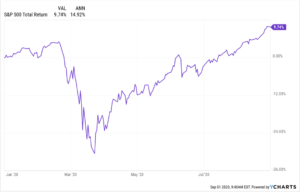
The 10-year “average, annual” return for the SP 500:
The “average, annual return” since January 1, 2000 is just a smidge over 6%.
The same return the last 10 years (through 8/31//20) is over 14%.
Near-term, a good case can be made for the SP 500 being overbought.
Top 10 Holdings as of 8/31/20, and YTD return:
- Microsoft (MSFT): +43.98%
- Amazon (AMZN): +94.28%
- BlackRock SIO (BASIX): +2.81%
- JP Morgan Income (JMSIX): -0.70%
- Nasdaq 100 ETF (QQQ): +39.23%
- Vanguard Emerging Mkts (VWO): -0.02%
- JP Morgan (JPM): -26.19%
- Loomis Sayles (LSBRX): -2.39%
- Tesla (TSLA): +495.61%
- Charles Schwab (SCHW): -5.30%
Top 10 individual equity positions:
- Microsoft: +43.98%
- Amazon: +94.28%
- QQQ: +39.23%
- Vanguard (VWO): -0.02%
- JP Morgan (JPM): -26.19%
- Tesla (TSLA): +495.61%
- Schwab (SCHW): -5.30%
- Visa (V): +13.3%
- Coca-Cola (KO): -9.03%
- Biotech ETF (XBI): +17.58%
The SPY was +9.58% as of */31/20, while the Barclay’s Agg was up +6.85%.
(All total return data sourced from Morningstar Premium, Inc.)
Check Tesla’s return YTD, pretty amazing. Stock is down this morning on the $5 bl share offering.
The goal of portfolio construction is to have the top-weighted names outperforming the SP 500, and then barbelling or balancing the rest of the portfolio with what is not-working (non-momentum) sectors or stocks to reduce rotation risk. Hence, the top two financial stocks were kept for clients – JP Morgan and Schwab – as well as the Emerging Markets position (VWO).
No Tesla has been bought this year at all for clients. In fact a few shares were trimmed. The gain in the stock in terms of it’s weighting in client accounts is all market appreciation, not new purchases.
Corporate credit markets remain healthy. The corporate investment-grade market is probably fully-valued, or will be within the next few months, but we remain tactically overweight within corporate high-yield.
Turnover in client portfolios is typically pretty low. We “tweak” positions over time, but look for long-term breakouts, like Microsoft. MSFT didn’t actually trade over it’s March, 2000 high until the back half of 2016, so the breakout is just now getting to 4 years old.
Most investors probably don’t realize that Microsoft has outperformed Apple from April, 2013 through the end of 2019. Apple still gets too much press, but it is outperforming Microsoft this year.
Here are earlier “Top 10 Holdings” posted to this blog (here, here, here) so readers can see that portfolios change slowly over time. Tax-efficient portfolios are important for client’s taxable accounts.
How big is “rotation risk” ?
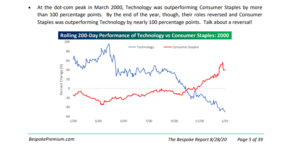
Bespoke noted the swing in Consumer Staples vs Tech in 2000.
Check that performance differential !
Be careful out there with the top names in the SP 500 and other momentum stocks.
Summary / conclusion: Until the momentum slows in the Top 5 – 10 names in the SP 500, the headlines will remain more of the same. It’s been a top-heavy market for a while, only exacerbated by Covid-19 and work-from-home (WFH) initiative.
The 20-year return for the SP 500 is still within a “normal” range. The last 5 – 10 years the SP 500’s “average, annual” return is extended.
CNBC reported that the market cap on Apple is now greater than the entire market cap of the Russell 2000.
Readers can guess where new money is going. Using the RSP (equal-weight SP 500), too.
Thanks for reading. Take everything you read here with great skepticism. Trend’s last until they don’t.
Thanks for reading.