The 2’s – 10’s Treasury note spread widened out to 57 basis points this week, the widest spread since (wait for it) June 5th’s 69 bp’s. The week of June 5th, 2020, the 2 – 10’s spread jumped 20 basis points in the week, while this past week, the spread widened 14 bp’s from the week prior. Inflation data running very hot, but given the increases in the inflation data, the 10-yr Treasury taking it in stride (so far).
SP 500 EPS revisions:
This week, the SP 500 saw it’s first week of weaker positive revisions since early July, but the important data is the weekly SP 500 return posted after the revision data.
Only three of the last 13 weeks have seen a negative return for the SP 500.
For the most part – since late March ’20 – SP 500 “positive revisions” have steadily increased every week since the number bottomed at 12% – 13% in the last two weeks of March – April ’20.
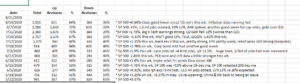
Refinitiv sources this data from IBES, but only the last 4 weeks is provided. The above spreadsheet goes all the way back to 2009.
Walmart’s earnings report Tuesday morning, August 18th, unofficially ends the 2nd quarter ’20 earnings season.
———————————————-
SP 500 Weekly Earnings Update:
- The “forward 4-qtr estimate” fell this week to $145.54 vs last week’s $145.92, the first sequential decline since the week ended June 30 ’20.
- The forward PE is 23x
- The SP 500 earnings yield is 4.32%, which is still very depressed but not as low as it was in the middle weeks of June ’20 when it struck 4.11% to 4.14%
Last week, this blog noted that the annual 2020 and 2021 EPS estimates were unusually stable. (Read the section above the “forward earnings curve”. )
This week that glitch was apparently fixed: note the increase in the annual SP 500 EPS changed after unusual stability:
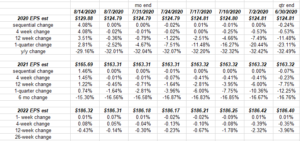
Note the increase in 2020 and 2021 SP 500 estimates this week:
- The 2020 SP 500 EPS estimate jumped $5.09 per share
- The 2021 SP 500 EPS estimate jumped $2.38 per share
My guess is there was a glitch somewhere in Refinitiv’s IBES data.
SP 500 Forward Earnings Curve:
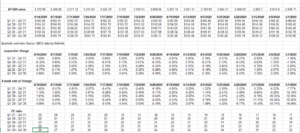
The forward earnings curve showed sharp increases in the “4-week rate of change” as result of the annual SP 500 EPS estimate increases for 2020 and 2021.
The forward SP 500 estimates continue to move gradually higher.
—————————————————
Style-Box Update:
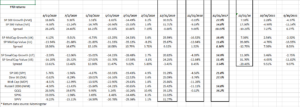
In what is no surprise to anyone, large-cap growth continues to dominate the returns of the rest of the small / mid-cap styles.
The bordered boxes are annual returns, and Value hasn’t beaten Growth since 2016.
Some RSP (equal-weight SP 500) has been added to client accounts, but the trend is still your friend.
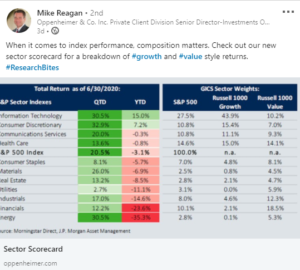
Michael Reagan of Oppenheimer (probably in Cincinnati) published this last week. Note Tech’s weight in the Russell 1000 Growth index. Yowser.
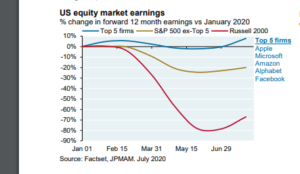
This graph from Michael Cembalest of JP Morgan shows the Top 5 SP 500 stocks and their earnings growth relative to the rest of the other 495 and then the Russell 2000.
To think the Russell 2000’s earnings were down as much as 80% y/y by late May ’20.
For those of us who follow “probabalistic” investing, you have to think adding the IWM or the Russell 2000 ETF to accounts would make sense.
If the JP Morgan graph doesn’t motivate you on the topic of the Russell 2000 vs. the SP 500, read this from Nick Colas and Jessica Rabe of DataTrek Research, a neat little blog at a reasonable price:
|
|
|
- Graph not shown. Tried to pick it up off the blog w/out success. Read the August 11th, DataTrek Research note for the full article. The data and DataTrek’s conclusion from the graph are provided above.
Big Tech is Global, too:
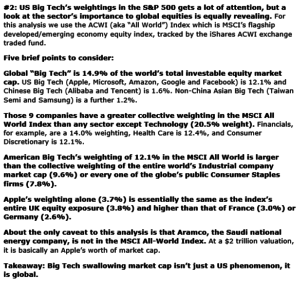
While the topic has been thoroughly exhausted in terms of Big Tech’s dominance of market-cap weighted indices, Nick Colas and Jessica Rabe talk about the dominance of Big Tech across global markets, not just the SP 500 and the Nasdaq.
Summary / conclusion: The case continues to grow for some “rotation” into beaten-down sectors of the capital markets, except for the fact that the SP 500’s Big 5 (top 5 market-cap names in the SP 500) earnings and revenue continue to grow well above the rate of the rest of the SP 500 and anywhere else around the globe. To call them the only game in town, is not a gross oversimplification.
And yet, we all know that will change some day.
Selling Apple and Facebook was gross stupidity in 2018, but I never thought Apple would make the seamless transition to the services business from a tech hardware company, and Facebook’s Cambridge Analytica fiasco and what they did with user data, made me conclude the company wasn’t trustworthy.
Wow, those two sales did not stand the test of time very well.
This tech dominance will end at some point. One potential catalyst could be the 2020 Presidential election. The two parties have very different views towards business, regulation and global trade.
The thing is, in 2000, the Nasdaq had peaked well before the election in November, 2000. Intel was the first earnings warning in September, 2000 and then Cisco followed in January, 2001.
Funny, that 20 years later the same two stocks are warning again, just from very different valuation levels and growth expectations.
I struggles with today’s post and jumped around in terms of topics. Hope readers found it helpful.
Take everything you read here with a substantial skepticism. Make decisions based on your own financial condition and profile, and your own circumstances.
Seriously, the reading audience is appreciated. Send me an email at brianglm@trinityasset.com with questions or comments.
Thanks for reading.