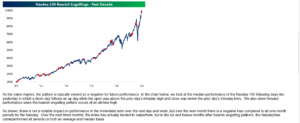
The “outside reversal day” on Monday, July 13th, 2020 for the Nasdaq 100 still looms large as we approach Q2 ’20 earnings season for the Tech sector.
Even Barron’s had a little note on it Friday, saying, “In fact there have been just 9 other times where the index gained 1% only to finish the day down more than 1%. Three months later the Nasdaq was lower 60% of the time, with an average loss of 4.4%.”
Is a 4.4% “average” loss three months later, enough to rack up capital gains in taxable accounts or reallocate significantly to other sectors or asset classes ? My first instinct is to say “no” given current investor sentiment, but it all depends too. The Barron’s article went in to talk about the VXN or the CBOE Nasdaq Volatility Index action, and how it’s recent action has “tended to correspond to absolute and relative performance (in the Nasdaq 100) especially on a three-month time frame.”
After Monday’s reversal, Bespoke had this to say about the historical pattern of Nasdaq reversals:
The bottom paragraph of the Bespoke note is the key conclusion.
The evidence seems to be there to lighten up on your Nasdaq-100 and Tech exposure, but not to a degree that might have been warranted in March, 2000.
3 – 4 years ago, the CFA Society of Chicago held one of their patented Vault Series featuring one speaker who gives a brief 3-minute lecture followed by Q&A, and the author of the article linked below, David Ranson, was the featured speaker. David is an old-school type gentleman who has been around Wall Street many years, with a blue-chip background in government, academia and Wall Street.
This article – RansonJune30rebalancing – talks about the potential performance advantage in re-balancing portfolios at the end of June every year, as opposed to waiting until the end of December.
Again, with the action in the Nasdaq 100 this week, I thought the article might be timely for readers. (Like all good academic articles, the statistics are plentiful and the jargon dry. Start with the conclusion, get the sense of what David is trying to communicate, and then start from the top.)
Summary / conclusion: Market turning points can be littered with conflicting information. When the Nasdaq and large-cap growth peaked in March, 2000, I don’t know how many were predicting that we would see not one, but two 50% corrections in the SP 500 over the next decade, and that between the period from March, 2000, through mid-April, 2013, the SP 500 wouldn’t trade above 1,575 and investors essentially earned the dividend yield on the SP 500 for a period of 13 years.
It’s doubtful we are anything close to that kind of secular change but questions remain: to what degree does market leadership change ? Should small-cap value – a huge underperformer to large-cap growth over the last few years be bought, or should the inverse QQQ simply be bought to hedge the expected Nasdaq-100 weakness ? Will value start to outperform, and to what degree ?
So many questions, and one way to “think-out-loud” about the possibilities is to write about it, and put thoughts to paper.
This blog’s article from earlier in the week felt like the right conclusion, but again it still leaves many questions.
Take everything you read on this blog with great skepticism. No one strategy, style, firm, or manager, gets the market right all the time. Do your own homework and invest based on your own risk tolerance and financial profile.
Thanks for reading.