David Aurelio of Refinitiv is doing an earnings conference call tomorrow, i.e. Wednesday morning, June 24th, 2020 at 11:00 am central time. Search the Refinitiv website or David Aurelio’s blog for the details. This blog’s source earnings data comes from Refinitiv, which sources the data from IBES. David Aurelio has been managing the “This Week in Earnings” report published every Friday afternoon for years. and before David it was John Butters at FactSet, and well before that it was Michael Thompson in the early 2000’s. Refinitiv used to be Thomson First Call.
Here is a table of 2nd, 3rd and 4th quarter year-over-year growth estimates for the Financial sector. For Financial’s and the SP 500 as a whole, it is widely expected that Q2 ’20 will be the nadir for SP 500 earnings and revenue growth and the y/y growth rates will start to move higher (be less negative) for Q3 and Q4 ’20.
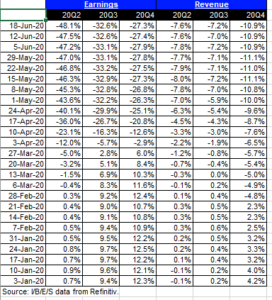
What surprised me about the about above data, was that while Financial earnings growth rates will improve after the 2nd quarter lows, Financial sector revenue will not, i.e. both the 2nd and 3rd quarter of 2020 Financial sector revenue will decine roughly -7%, while the 4th quarter of 2020 revenue decline is expected to be worse at -10%.
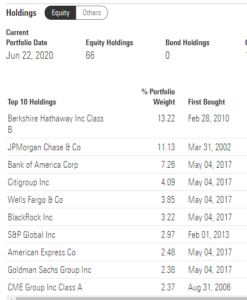
Here are the Top 10 Holdings of the XLF as of June 22, 2020: (Source: Morningstar)
Here are the Top 10 Holdings of the IYF as of June 20, 2020: (Source: Morningstar)
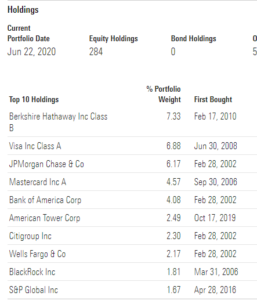
For both Financial ETF’s, Berkshire and JP Morgan are the two largest components. Bank of America is also a Top 5 holding in each.
Here is what’s important about the ETF major holdings:
Readers may be wondering, “what’s the point ?”
Financial’s as percentage of the SP 500’s market cap has fallen to 10.3% as of today’s Refinitiv data, BUT the “earnings weight” of the Financial sector within the SP 500 is closer 17%.
We wrote about this a few times in the early part of last decade, after the so-called, “Great Financial Crisis”. Coming out of 2009, Financial’s were punk from 2010 – 2012, and then caught fire in 2013 with the Bernanke Taper Tantrum.
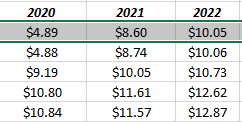
What’s the trend in JP Morgan’s EPS and revenue estimates for 2020 ?
The current estimates as of June 23, 20 per the data, are: 2020, $5.03, 2021, $8.67, 2022, $10.14
Each line, starting with the bottom and January 31, represents the consensus EPS estimate for JP Morgan’s calendar year.
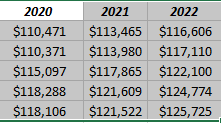
The consensus revenue estimates as of June 23, 20 for JPM are:
2020: $110, 771, 2021: $113,507, 2022, 2022: $116,509.
Again, it’s too early and rather insignificant right now, both both JP Morgan’s EPS and revenue estimates are on track for two straight months of higher revisions.
When Looking at JP Morgan’s revenue vs Bank of America, JP Morgan’s full-year 2019 net revenue was $115.6 billion while Bank of America’s was $86.6 billion. JP Morgan’s is 1/3rd larger from a revenue standpoint.
Summary / Conclusion: Does a 10% market cap weight versus a 17% Earnings Weight in the SP 500 mean Financial’s are a “value” sector today ? One of the arguments about the Tech and large-cap growth bubble in 1999 and early 2000 was that Tech was 33% of the SP 500’s market cap, while the sector was just 13% of it’s earnings weight in the late 1990’s. Is that argument compelling and logical ?
One thing that bothers me about Financial’s in general and JP Morgan specifically is that “everyone” is bullish JP Morgan and most sell-side analysts like the banking and Financial sector, based on comparisons to 2008. Maybe it’s the stalled buybacks that are making the stocks trade like they are all carrying piano’s on their back. JPM, BAC, and so many others look like they might get some “mo” and then – whack – they get knocked right back down.
From a portfolio construction standpoint, clients are overweight Technology, but right below the major Tech names are names like JP Morgan (JPM), Charles Schwab (SCHW), CME (CME), Goldman Sachs (GS), etc.
Here is a post that was done April 16th on expected bank credit losses for 2020. That was a much more pessimistic time.
Credit losses and net interest margin declines were the two big reasons for the decline in the Financials. It’s unlikely net interest margin guidance will change much in 2020, but there is a chance that worst-case credit losses may not be near as large as originally feared.
Talk all of this as one opinion and with great skepticism.
Thanks for reading.