The earlier posts this week on SP 500 revenue growth from Tuesday and Friday continue to reflect the positive revision pattern of higher revisions to expected forward revenue growth at a time when the typical pattern is downward pressure. That’s a very good sign.
Technology, at 22% of the SP by market cap, and the largest sector within the SP 500, continues to see higher upward revisions to revenue, if only slightly, but the revisions are still higher.
This same pattern was in evidence last May 21, 2016, when readers were first told that 2017 would be a good year for SP 500 earnings with this blog post exactly one year ago today. (In 2016, what jumped out was was the SP 500 earnings estimates though, not the forward revenue estimates.)
A year ago, to think the SP 500 would see 10% earnings growth in 2017 was laughable, and yet the current bottom-up EPS estimate for 2017 is now 11%.
To be frank with readers though, the “so-called” earnings recession was really nothing more than the drag of the Energy sector on the SP 500. The Energy sector at its peak was 15% of the SP 500 by market cap, in mid-2014, only to fall to less than 5% by early 2016. Energy today is roughly 7% – 8% of the SP 500.
Thomson Reuters I/B/E/S data (by the numbers):
- Fwd 4-qtr estimate: $134.79 vs. last week’s $134.96
- P.E ratio: 17.7(x)
- PEG ratio: 1.9(x)
- SP 500 earnings yield: 5.66% vs. last week’s 5.64% and the year ago’s of 6% even.
- Year-over-year growth of fwd estimate: +9.37% vs. last week’s +9.72% and a year ago’s +0.94% (yes, less than 1%).
Analysis / conclusion: Two metrics caught my eye this week: the “y/y growth rate of the forward estimate” and the SP 500 earnings yield. Looking at past corrections, the SP 500 has bottomed a few times or gets interesting from a valuation perspective typically when the SP 500 earnings yield reaches 6%. Assuming we leave the “forward 4-quarter estimate flat at $134.79, the SP 500 reaches a 6% earnings yield with a drop to 2,250, or roughly the 200-day moving average.
The other metric is the “y/y growth of the forward 4-qtr estimate” – it has now fallen for 3 straight quarters, not enough to warrant yelling “fire” but pay attention to trends.
Here is the pattern:
- 5/19/17: +9.37% y/y growth in forward estimate
- 5/12/17: +9.72% y/y growth in forward estimate
- 5/05/17: +9.80% y/y growth in forward estimate
- 4/28/17: +8.21% y/y growth in forward estimate
- 4/21/17: +8.29% y/y growth in forward estimate
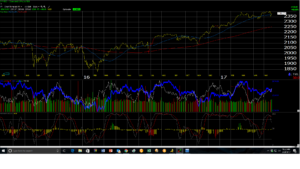
The SP 500 reached a 6% earnings yield in late June ’16, pre-Brexit, and then again in early November ’16, pre-Presidential election. In 2015 and the first half of 2016, the SP 500 earnings yield gravitated around 6%. In 2015, the SP 500 was flat on the year in terms of total return, and up roughly 12% in ’16. (Coincidentally, the late June ’16 and early November ’16 bottoms were very close to the 200-day moving average on the SP 500 too. See the daily SP 500 chart at the bottom of this page.)
A 6% SP 500 earnings yield may not be the catalyst for a sharp rally, but it does seem to indicate that the SP 500 is a lot more interesting from a valuation perspective.
While the SP 500 earnings and revenue metrics indicate a healthy market, I wouldn’t rule out a SP 500 test of the 200-day moving average, which would restore the SP 500 earnings yield to the 6% range, or a point where – at least in the last few years – the risk/reward level tilts to “more reward” and less risk.
The bigger picture is that SP 500 earnings and revenue are in good shape. That doesn’t rule out a bigger correction though for the SP 500. If the SP 500 earnings yield gets to 6%, that has typically been the earnings yield level where the SP 500 offers more reward than risk.
Thanks for reading.