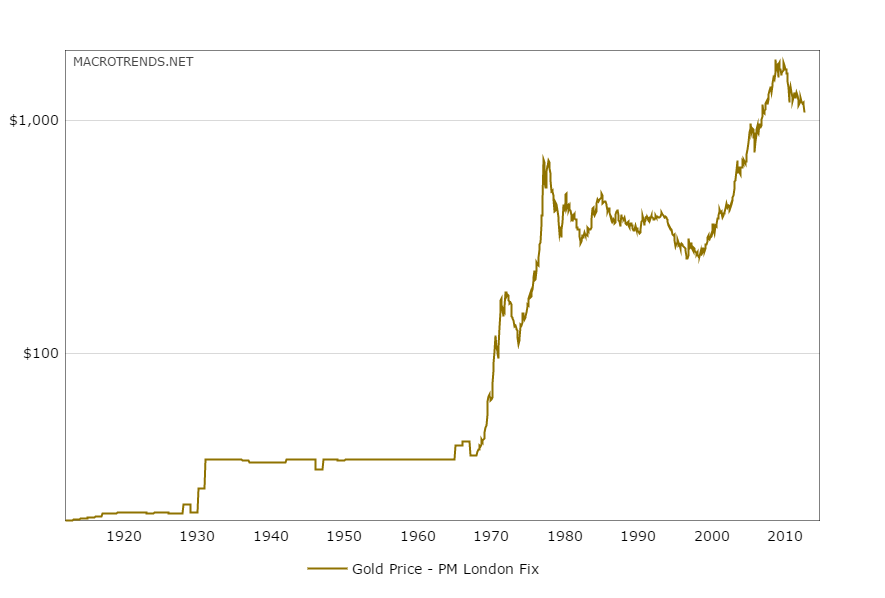
The above chart, cut-and-pasted from MacroTrends, is an excellent pictorial of the price of gold bullion since the early 20th Century.
I was in college back in the late 1970’s, early 1980’s when gold was hitting its peak, which at that time I thought was near $800 per ounce.
It was very interesting to watch gold in the next two decades and the never-ending cacophony of what Josh Brown (@reformedbroker) calls the never-ending gold zealots, as gold bullion fell from $800 in 1980 to what I thought was a $200 – $300 cash price in the late 1990’s, as Technology and growth stocks were nearing their peaks.
For me anyway, just from anecdotally observing the gold price action and stock prices, gold and the SP 500 should have a low correlation over a long period of time.
However, technically anyway, for you Fibonacci fans out there, if gold bottomed in the late 1990’s between $200 – $300 and then peaked in 2011 near $1,800, a 50% retracement of the 2000 to 2011 rally should mean that gold and the GLD could be bought between $900 and $1,000.
So what’s the point ? Under $1,000 and gold gets interesting in my opinion, from a technical perspective, but I really think that a sustained rally in gold, would require either a bear market in the SP 500 or prolonged subdued returns in the SP 500 and the major equity indices.
Most gold aficionados think of gold as an inflation hedge: I would beg to differ. The 1970’s, a decade where where gold soared, was a decade of subdued equity returns thanks to 1973 – 1974 bear market of 50%, partly caused by OPEC and the price of oil, and partly caused by Watergate and the Constitutional Crisis therein (in my opinion), not to mention Nixon’s price controls and Whip Inflation Now (WIN), and the followed by Jimmy Carter and the disaster that was Iran.
Rather than an inflation hedge, gold’s rally from 2000 through 2011 also occurred at a time when we saw the worst decade of SP 500 returns since the 1930’s.
In my opinion, which is just an opinion, gold is a pretty decent hedge for longer-term lousy returns within the SP 500. The two decades where gold soared, the 1970’s and the 2000’s, were periods of both above-average inflation, and then a decade of pretty serious asset deflation, i.e. housing prices and stock prices.
And after the two giant SP 500 bear markets between 2000 – 2009, I dont think we are close to that type of decade of equity returns.
I do think Yellen and the Fed want a little inflation: it means that the US economy is returning to a more “normal” state, and I do think a little inflation would be good for stocks, particularly retailers.
Bottom line: gold’s action between $900 and $1,000 will be interesting. The GLD ETF was owned for clients between 2000 and 2011, where we made the last sold of GLD between $155 and $160. (More and more, with the proliferation of ETF’s, I am using commodity ETF’s rather than operating companies with a significant exposure to commodities, like Alcoa (AA), Freeport (FCX), etc. Prior to the launch of the GLD, I owned Newmont Mining (NEM) for clients, which in my opinion doubles the risk for investors. Look at some of the decisions Freeport’s management made in 2013 and 2014.)
Commodity companies and commodity businesses are notoriously low return businesses. The best period for the stocks and commodities was the explosion in China growth between 2000 and 2012. A return to global growth, whenever that would happen, could change the calculus for the commodity asset class.