It’s hard to be bearish when investors are seeing SP 500 calendar year EPS estimates get revised like this:
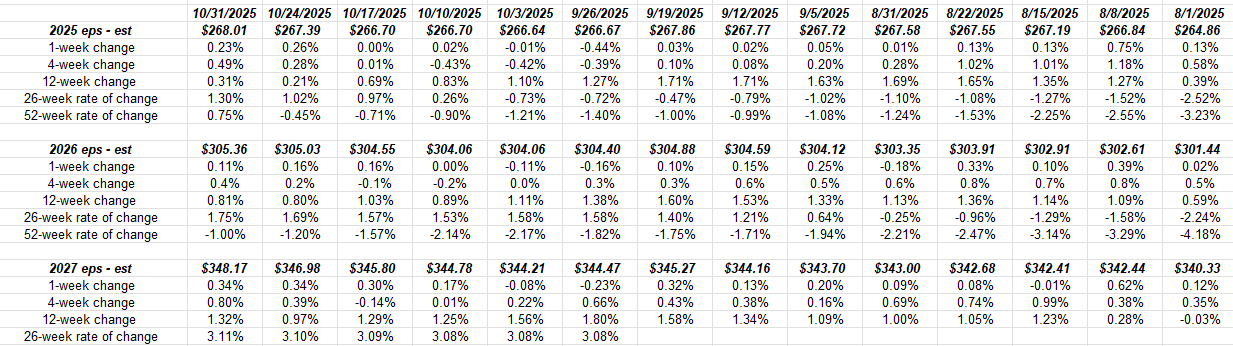
Source: LSEG – click on spreadsheet to expand
Note the positive revisions in the 2027 EPS estimate since August 1 ’25.
Someone will reach out and ask, “Yes, but do you believe those estimates ?” and my typical response will probably be, it’s not my job to predict whether those estimates will be greater or less than today, when we get to these future dates, but rather lay out the data and show the trends.
As someone who survived 2000 to 2009 with a book of business intact, I’m probably more nervous about this three years of SP 500 returns than almost anybody, but chances are if you’ve been reading this blog the last 15 years or picking up the content elsewhere (like www.seekingalpha.com) then you’re probably a more thoughtful investor than the average individual.
The one aspect of SP 500 earnings that is less predictable is the concept of, “PE expansion / contraction”.
Currently SP 500 EPS is expected to grow in 2026 at 14%, so if the SP 500 benchmark just meets that EPS growth target in ’26 and returns 14%, it will be the 4th year in a row of mid-teens or better returns for the benchmark, with ’23 and ’24 returns being 25% each.
That will be highly unusual. The last 5 years of the 20th Century saw +20% returns on the SP 500 for five years in a row – that had never happened in the SP 500 return data I’ve seen which begins in 1970.
We’ll see: higher SP 500 estimates from positive revisions, gradually declining short-term interest rates from an easier Fed, and a pro-business Administration in Washington, all represent tailwinds for solid market returns.
SP 500 data:
- The forward 4-quarter estimate this week jumped to $294.87 from last weeks $294.81 and August 1’st’s $281.15.
- The forward PE is 23.2x, but the PE on the 2025 SP 500 EPS estimate (see top spreadsheet) is now 26x.
- The SP 500 “earnings yield” ended 10/31 at 4.31%, which is lower than I’d like to see it. In June and July ’25 the EY was between 4.40% and 4.50%. It should be closer to 5% to put new money to work in the SP 500 index.
- The metric for high-yield credit spreads fell from +301 last week to +276 as of Friday, 10/31. The credit scare is abating, but credit spreads are so tight it’s hard to buy public high yield at these levels.
- Q3 ’25 SP 500 revenue growth is +7.5% y-o-y. This blog has kept the data and since Q1 ’23, or “post-Covid” SP 500 revenue has averaged 4.2% through Q2 ’25 or the last 11 quarters.
Check the quarterly SP 500 EPS and revenue growth estimates:
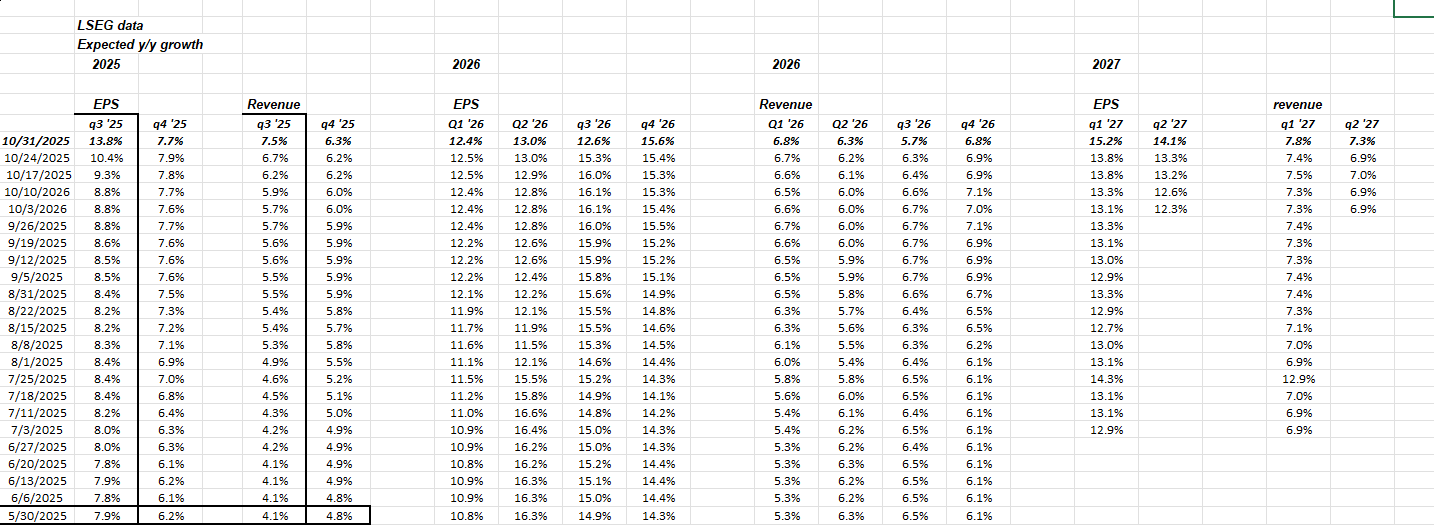
Source: LSEG, Earnings Scorecard
Since the bottom Memorial Day weekend (black-bordered line) this year, check the EPS and revenue revisions by quarter for the SP 500.
Note – in the upper lefthand corner, the EPS and revenue revisions for Q3 ’25 EPS and Q# ’25 revenue, between this week and last week.
The power of the tech sector.
Summary / conclusion: Wonky stuff, just remember, the numbers and revisions can and do look great, but the market can head the opposite direction. 2025 has been emblematic of a year where the market rallies relentlessly in smaller increments – particularly since early April ’25 – with little chance to get in at lower prices.
It’s not all tech, either. Many financials have been great performers with lower PE’s than the growth babies. Care to see an interesting statistic ? Since Q1 ’23, tech sector revenue growth through Q2 ’25, has averaged 8.2%, while the healthcare sector revenue has averaged 7.8%, yet the healthcare sector has been a doormat.
None of this is advice or a recommendation, but only an opinion. Past performance is no guarantee of future success. All SP 500 EPS data is sourced from LSEG. Readers should gauge their own comfort with portfolio volatility. This blog is written – usually weekly – to force the updating of the data. None of this information may be updated, and if updated, may not be done in a timely fashion.
Thanks for reading.
Hi Brian.
Great info as always. Is the health sector rev growth predominantly due to GLP1’s? Is it known if the rev growth is highly concentrated in the ozempic type names? Doss t it even matter? I guess one could say all the growth in tech is concentrated at the top Mega caps too.
Jsut curious
Thank you
Good questions.