- This week, The SP 500’s forward 4-quarter estimate (FFQE) rose to $284.21, versus last weeks $284.02.
- The PE on the forward estimate is now 23.4x, and the SP 500 earnings yield as of Friday’s, Sept 19th close is 4.26%.
- Every calendar year SP 500 EPS estimate for ’25, ’26 and ’27, rose again this past week.
- In the last 12 weeks of calculating the forward estimate, it’s only sequentially-declined once.
- Nothing has changed about the steady advance in SP 500 earnings since bottoming May 30, ’25.
Technical analysis:
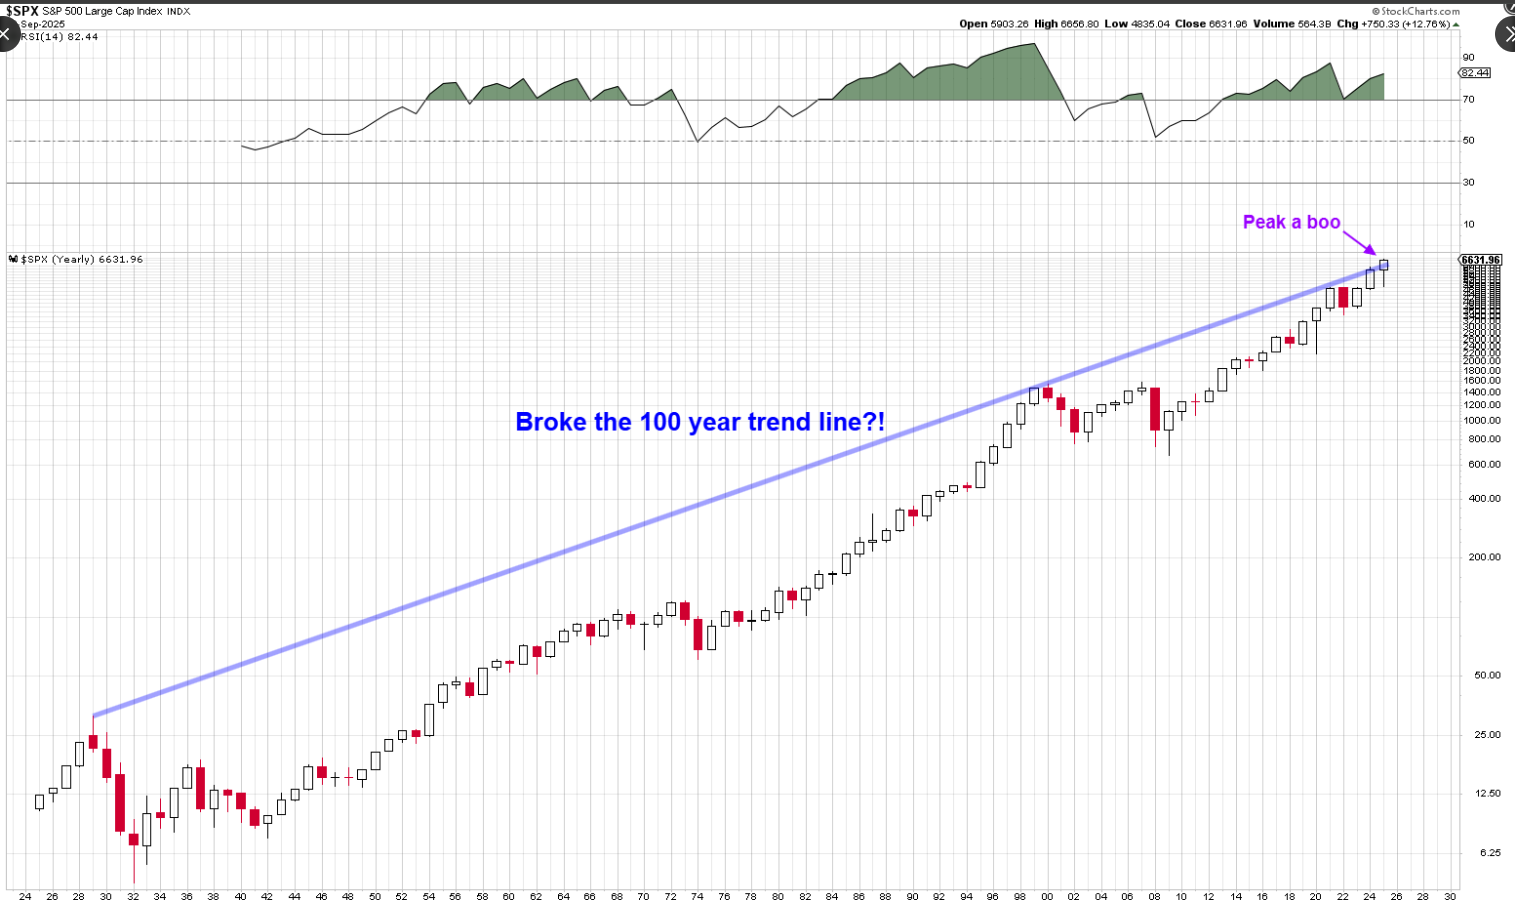
(H/t Heisenburg from (9/18)
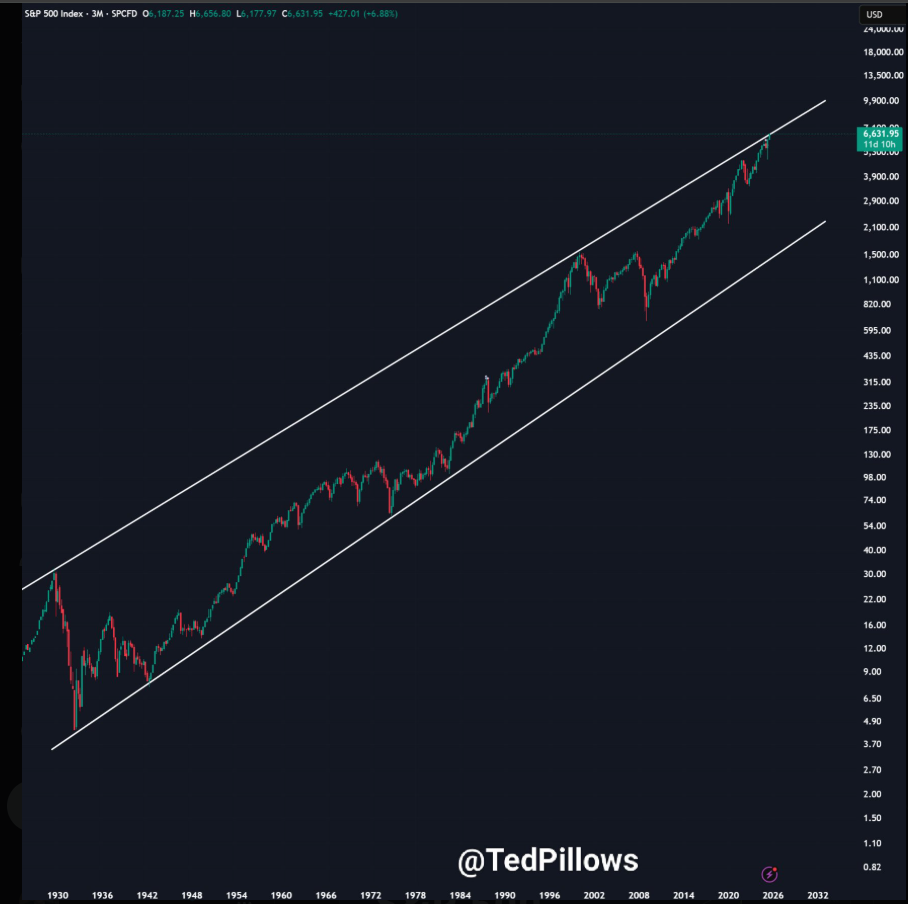
(h/tip to @TedPillows 9/19)
Looking at 100-year channels for the SP 500 as the above two charts reflect, can give one pause in the current environment.
Do these longer-term charts worry me ? Absolutely. The one element missing though, from the late 1990’s large-cap growth and tech bubble, is that today’s SP 500 bull market is a much more “orderly” advance than what we saw in the late 1990’s, particularly from the retail investor perspective.
In this bull market, no one is calling demanding to be 100% invested in technology stocks. The SP 500 rally that begin in 1995 with the SP 500’s 37.58% return, lit a roman candle that wasn’t extinguished until March 10th, 2000. It was a remarkable period. Few people realize that from early October, 1999 to March 10th, 2000, the Nasdaq 100 rose 100%. The other characteristic about that time was clients with taxable accounts, didnt want big capital gains, and they didn’t realize how mutually exclusive these two objectives were. Yes, they wanted big returns, but they also wanted limited taxes, because they thought that the returns would continue indefinitely. In 2023 and 2024, very few clients even realized that the SP 500 was up 25% both years.
It’s strictly a personal opinion on market tone, but this SP 500 rally feels much more “sedate” and almost boring in nature.
The big report this week (in my opinion) will be Micron Technology (MU), who reports their fiscal Q4 ’25 financial results Tuesday night, September 23rd, after the market close. The expectations are high for MU, with EPS estimates expecting 45% revenue growth and 142% EPS growth. The big driver for MU is the HBM3E high band-width memory chip (being sold to NVDA), which as of last quarter had jumped to 20% of Micron’s total revenue. While not as prominent as Nvidia (NVDA) or Broadcom’s (AVGO) position in the SMH (semiconductor ETF), MU is now the 4th largest position in the SMH as of last Friday, September 19th’s close.
Summary / conclusion: If you look at the historical data, stocks in general tend to perform well, following reductions in the fed funds rate, particularly if there is a series of reductions as opposed to the long lag we’ve seen between 2024 fed funds rate reductions and the fed funds drop to 4.125% last week.
Three fed funds rate cuts this year, probably bodes well for continued stock and bond returns in 2025.
That being said, remain cognizant of the risks, and they are expanding.
Tomorrow this blog will feature another post which will contain a few more “negatives” to remain aware of, in terms of the secular bull market setup. If this doesn’t interest you, I get it completely, but part of the reason of starting this blog 15 years ago was to write out what’s rattling around the empty space between my ears, and see how it “listens” in black and white on a sheet of paper.
Everyone makes mistakes, just don’t repeat them.
None of this is advice or a recommendation, but only an opinion. Past performance is no guarantee of future results. All SP 500 earnings data is sourced from LSEG.com. Clients and readers should gauge their own comfort with portfolio volatility and if they find capital markets too volatile, adjust accordingly.
Thanks for reading.
Well done. Will tune in next week, thanks.
thank you