You’d never know it looking at the sentiment data, but the SPY (SP 500 ETF) is down just -4.91% YTD.
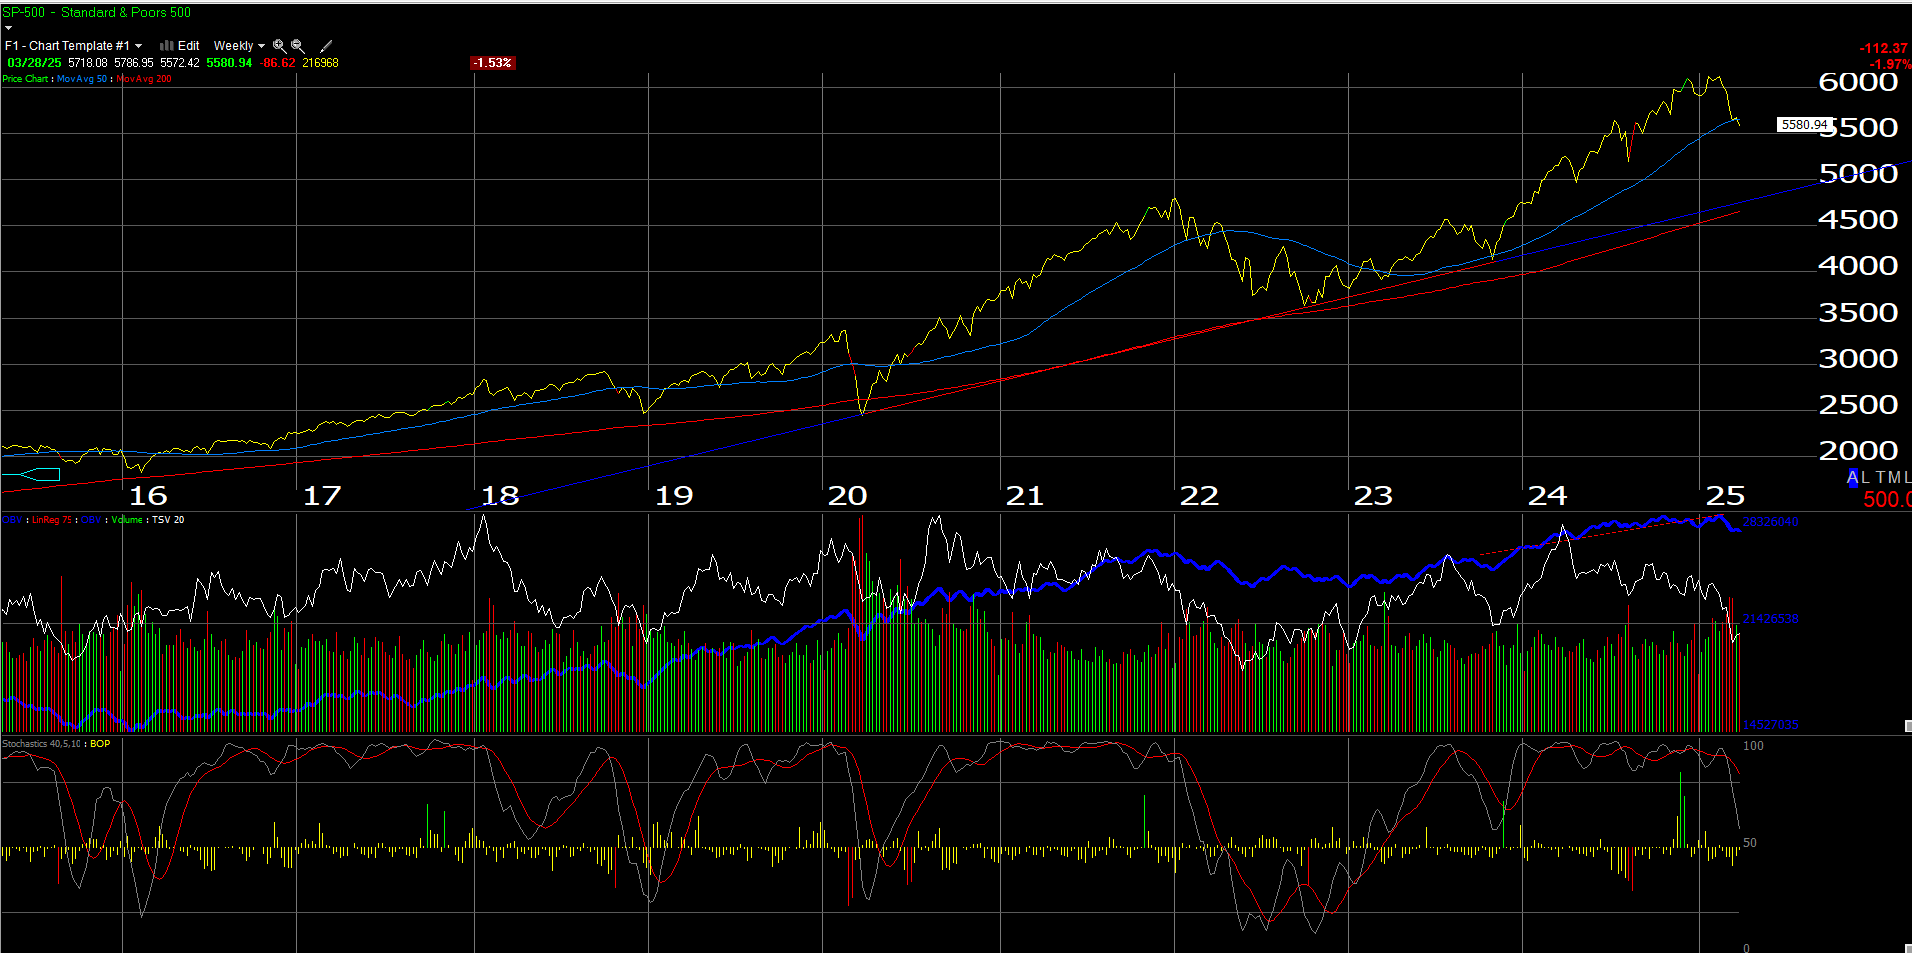
This weekly chart of the SP 500 from Worden shows potential downside to the SP 500, if the trendline off the Covid (March ’20) and late ’22 lows is touched, would indicate another 10% drop in the key benchmark from Friday’s close.
A 15% correction for the SP 500 is just an average correction since 1980.
Despite the sentiment ugliness, from the Bespoke Report this weekend, that “market breadth remains very much a positive:
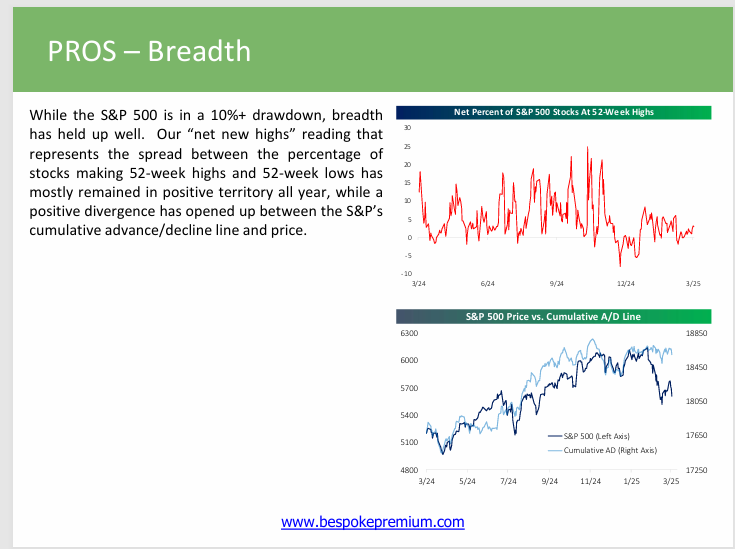
Breadth is important and I’m not necessarily a raging bull, but good breadth indicates that wide-range asset allocation changes may not be warranted (just yet). Ed Yardeni still believes that we’re in the “roaring 2020″s” which means favorable markets until later in the 2020’s.
Take it all – even this blog – with a healthy grain of salt, and know and understand your own risk tolerances.
High-yield credit spread history:
- 11/3/23: +415
- 8/9/24: +357 (Japan yen strengthening and fears of the BOJ hiking short-term bank rates drove a short-term panic)
- 11/15/24: +266 (4th quarter ’24 low when measured weekly)
- 3/28/25: +319 (some widening as the high-yield market has softened a little with the SP 500’s 5% drop)
This high-yield metric from Bespoke helps me keep an eye on high-yield spread volatility, and so far the widening of credit spreads is not nearly as dramatic as the drop in the Mag 7 stocks (I’ve never known the tech sector to be a big high-yield bond issuer, but maybe that’s changed), so despite what’s happening with equity and the mainstream media, corporate high-yield credit damage remains fairly contained.
The bigger high yield issuers are the energy, commodity and what is now the communication services (AT&T, and the now departed Baby Bells), so the high yield credit market is probably a better indicator of mature businesses in America versus the tech sector. It was interesting to me that Tesla was awarded an investment-grade credit rating by both Moody’s and Standard & Poors in late 2021.
As someone who is definitely not an expert on the high-yield credit market, but follows spread data, the critical funding market does not yet seem to be setting off alarms.
SP 500 earnings:
- We’ll get the quarterly bump next weekend, as we roll from Q1 ’25 – Q4 ’25’s forward 4-quarter EPS estimate FFQE), which presently stands at $269.12, to a new FFQE, which will capture Q2 ’25 through Q1 ’26. Since 2026 EPS estimates by quarter are not yet available at LSEG, that Q1 ’26 EPS estimate is not yet known, so assigning a reasonably-conservative EPS estimate to Q1 ’26 of $64.92 (8% expected growth from the expected Q1 ’25 EPS estimate of $60.11), the “new, expected but still unknown” Q2 ’25 – Q1 ’26 EPS estimate for the SP 500 next week should be approximately $273.67, when it arrives next weekend.
- The final calendar 2024 SP 500 EPS should be very close to today’s published print of $242 – $243 or 10% y-o-y growth.
- The expected calendar 2025 SP 500 estimate today is $269.12 or 11% y-o-y growth.
- To add 1 quarter that and sum Q2 ’25 through Q1’26, the expected FFQE next weekend will be (roughly) $273.67.
- The current 2026 SP 500 EPS estimate is currently $307 (or 14% expected growth over ’25) per the LSEG data, but expect that to come down over the next few quarters.
The math is pretty wonky since the process uses an estimate based off of another estimate, (Q1 ’26 SP 500 EPS is estimated from the Q1 ’25 SP 500 EPS estimate, and we won’t know an even reasonable approximation of Q1 ’25 earnings until the end of April ’25), so readers can see the frailty in doing this, even with a stable economy. The way the President is dropping tariff surprises, makes the process even more difficult.
But this is what makes both bull and bear stock markets.
Summary / conclusion:
My own opinion has been to be cautious about 2025, given the two consecutive years of +25% returns for the SP 500 in 2023 and 2024, as was detailed in this blog post.
But take all opinions with a grain of salt. The month of April has a strong pattern of robust monthly returns according to this bar chart posted to X, by Mike Zaccardi.
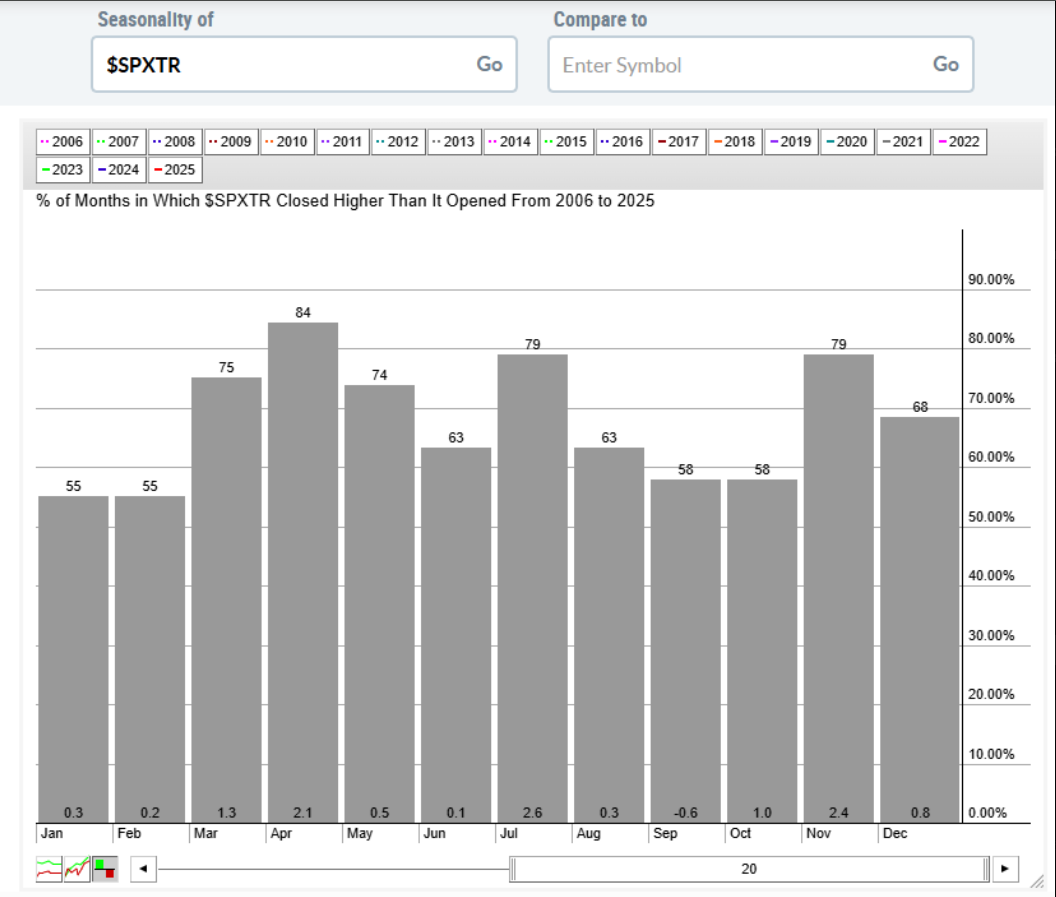
Per Zaccardi, April has been higher 15 of the last 18 years, with an average return of +2.1%.
Good breadth, and bad sentiment is usually a good combination, but always be wary of what you don’t know.
I’d love 2025 to be a +5 – 10% return year for the SP 500 and see sectors like utilities, staples, defense and industrials really outperform, and restore some balance to returns for investors, and give diversified portfolios a chance to shine.
The mega-cap 7, 10 and tech’s concentration within the SP 500 (29.9% of SP 500’s market cap, per the LSEG data this weekend) is exactly the same as the late 1990’s BUT the secular bull market rally has not been as robust since March, 2009, as what we experienced from 1982 – to 2000.
Given the President’s penchant for wanting to own the news cycle, it’s tough to be either a fundamental investor or a technician. Every day seems different.
None of this is an advice or a recommendation but only an opinion. Past performance is no guarantee of future results. Investing can and does involve the loss of principal, even for short periods of time. All of the SP 500 EPS data sourced above is from LSEG. None of the ab ove information may be updated, and if updated, may not be done so in a timely fashion.
Thanks for reading.