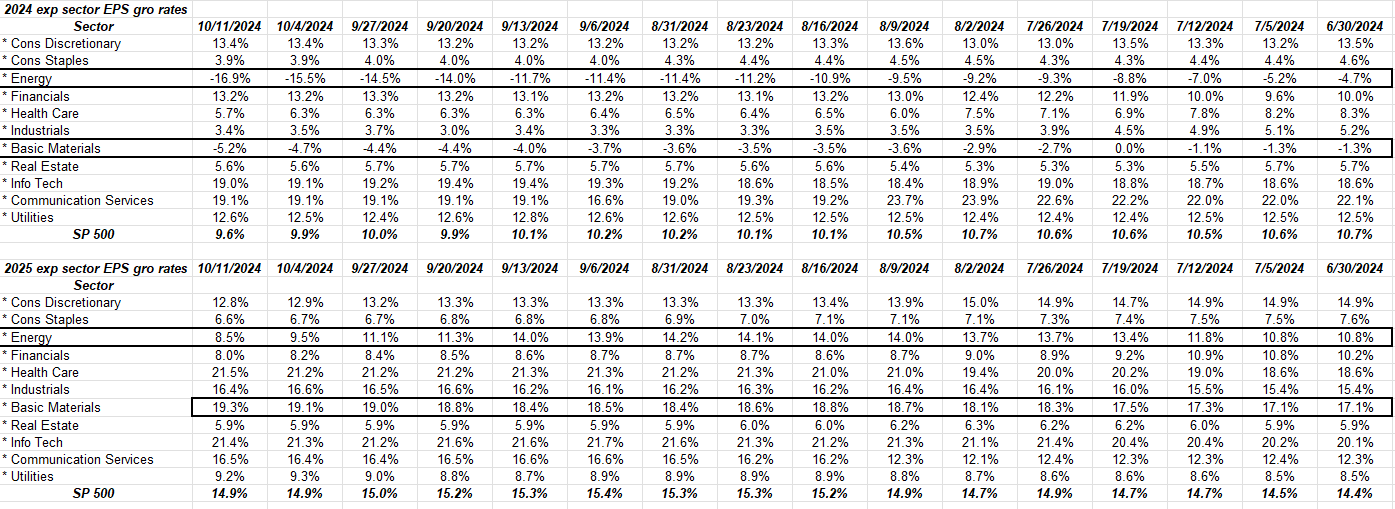
This table shows the “expected” SP 500 sector EPS growth for 2025.
Readers can see how the energy and basic materials sectors are expected to be a drag for 2024, i.e. the expected sector growth is a actually a full-year decline, and are the only sectors with expected negative declines in EPS growth in 2024.
The rub is – in terms of market cap weight – energy and basic materials are only 5.7% of the SP 500’s market cap weight as of 10/11/24.
SP 500 data:
- The forward 4-quarter estimate as of Friday, 10/11/24 was $266.09, down from $266.66 as of 10/4/24 and $252.85 as of June 30 ’24.
- The PE ratio on the forward estimate was 21.8x this week, versus 21.6x last week.
- The SP 500 earnings yield this week was 4.58%, vs 4.64% last week, and 4.63% as of June 30 ’24.
- The one earnings variable that will be watched this quarter will be the SP 500’s EPS and revenue “upside surprise”. Since only 29 companies have reported Q3 ’24 earnings so far as of 10/11/24, the revenue upside surprise is just +0.4%, while the EPS upside surprise is +6.8%. There is not meaningful sample size yet. so let’s see what next week shows.
- If the energy sector is removed from the SP 500 for Q3 ’24, the expected EPS growth jumps to +7.3%, versus the expected +4.9% today.
Here’s an interest stat for SP 500 earnings aficionados: the expected 2025 SP 500 EPS growth rate has remained stable at 14% – 15%, and has risen from an expected 11% as of May – June ’23. There has been little downward pressure on the forward calendar year EPS estimates for the SP 500.
Don’t assume that’s a market-timing reference: for me it’s just another indicator the US economy remains stable, with continued positive growth.
High-yield and high-grade credit spreads:
![]()
(Click on above spreadsheet to look at the trend in credit spreads.)
The above table shows the trend in high-yield and high-grade credit spreads since mid-May ’24.
High-yield credit, which is my early-warning recession indicator has the “average” high yield credit spread back under +300 the equivalent-maturity Treasury.
According to this chart from Schwab’s Kathy Jones, the corporate investment-grade OAS (option-adjusted spread) is nearing it’s tightest levels in 20 years.
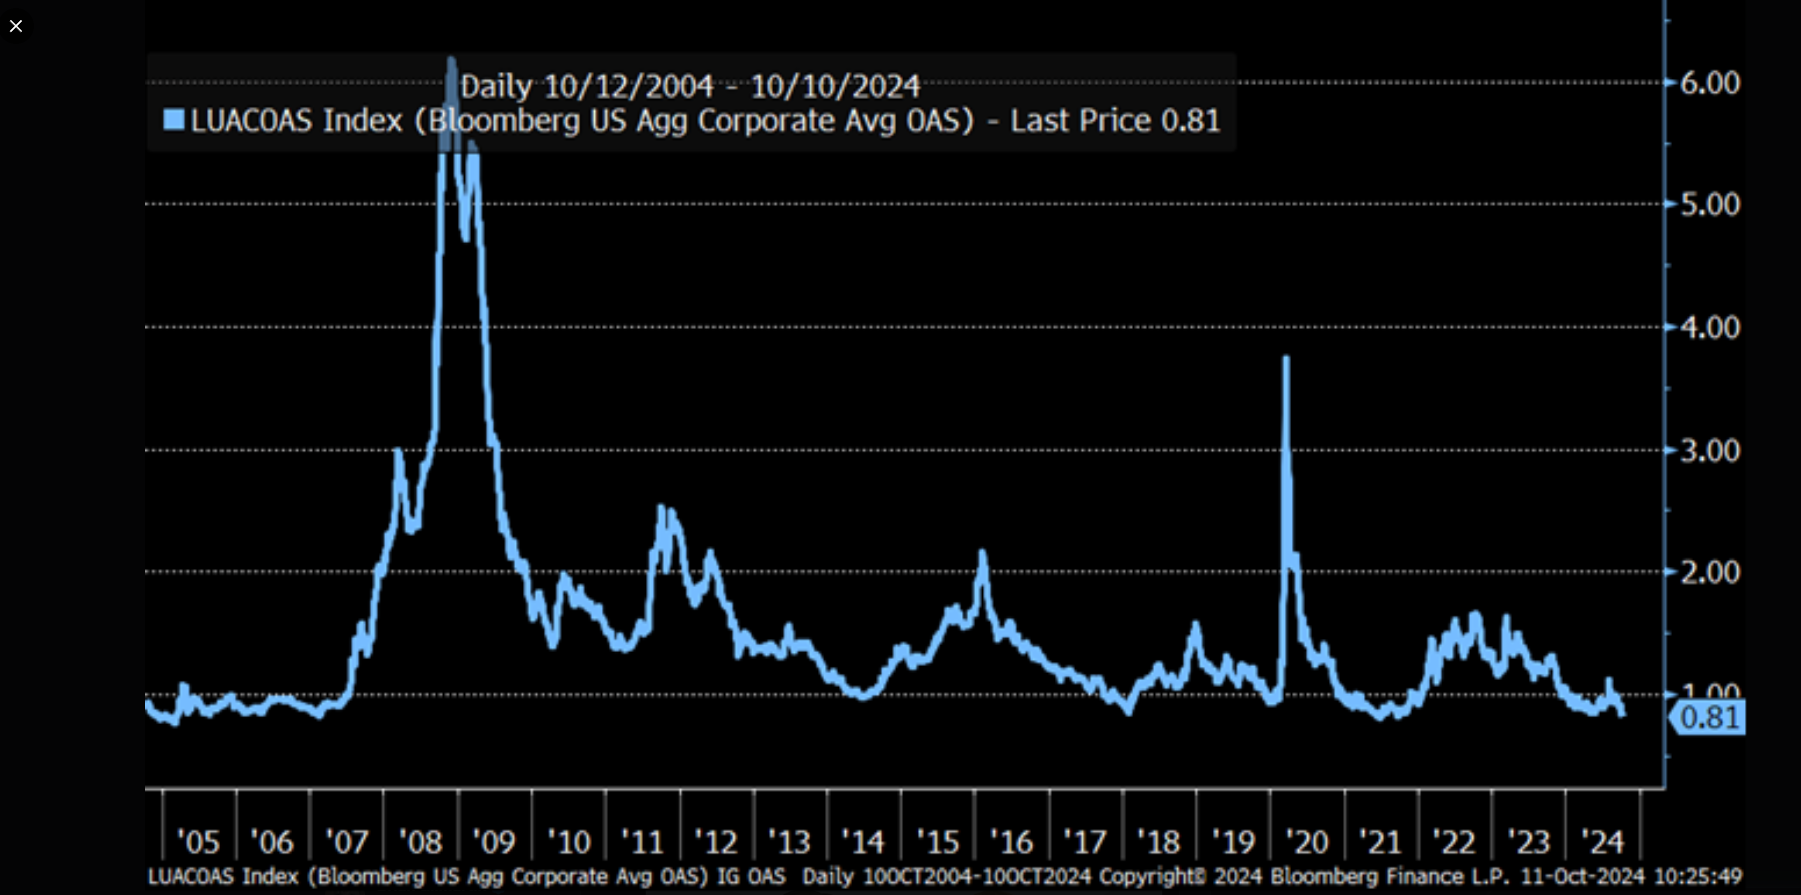
The credit markets are still giving no indication that even a small recession is imminent.
The interesting thing from a credit perspective which ties in to the SP 500 earnings headline today, is that energy and basic materials (i.e. commodity companies) have a larger market cap weight in the credit markets than the equity markets, meaning the bonds outstanding for energy and commodity companies are far more influential to the credit markets than the stocks are to the equity market (as evidenced by the market cap weights).
Summary / conclusion: Credit markets matter, but equity markets matter more in terms of long-term wealth creation, just have an idea of what’s going on in both markets if you are managing your own money with individual stocks, ETF’s or mutual funds.
The early results on Q3 ’24 earnings showed great results from the banks, maybe a little softer results from Delta and Pepsi. Delta missed on EPS, only grew revenue y-o-y 1% in the latest quarter and the stock rose 4% on the week.
Readers are looking at almost pristine conditions in the financial sector today, and the stock price reaction after Friday morning, October 11th’s earnings results show that. At some point this will change, so watch those credit spreads.
None of this is advice or a recommendation. Past performance is no guarantee or even suggestion of future results. Investing can and does involve the loss of principal even for short periods of time. All EPS and revenue data for the SP 500 mis sourced from LSEG.
Thanks for reading.