
Chris Kimble is an excellent technician, running Kimble Charting Solutions.
Note the breakout on the SMH chart above. The next fibonacci level is 1,000 points higher.
Here’s another good chart from Bespoke today on the relative strength of the SOX versus the SPY:

Finally as a fundamental investor at heart, here’s the EPS and revenue estimate revisions for Nvidia (NVDA), before and after last weeks earnings:
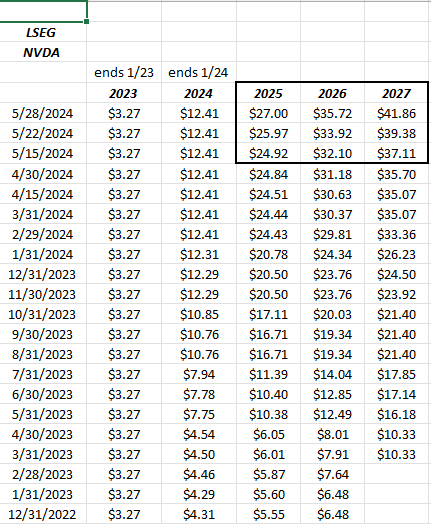
The block highlighted is simply the estimate changes for each of the next 3 fiscal years since mid-month (5/15) and then as of the day of the earnings release (5/22/24) up until today, 5/28/24.
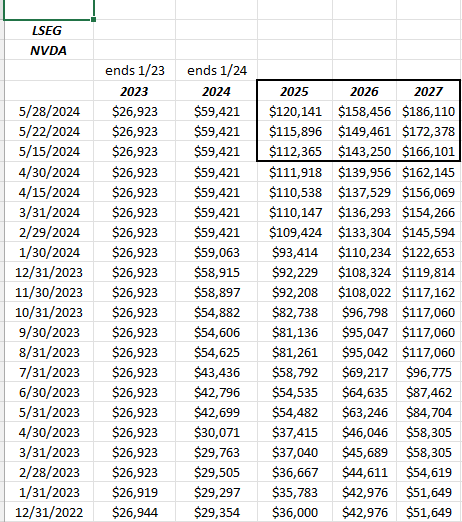
What’s even more impressive than the EPS revisions is the size of the revenue estimate revisions in such a short period of time.
Summary / Conclusion: There is too much being written about the semi sector and NVDA these days, so this will be the last comment on it for a while. But Chris Kimble’s chart above, and the size of those estimate revisions on NVDA, are powerful reasons to be long the SMH.
Crude oil rose 2% and Treasury yields rose after a lousy auction, which put threw a wet blanket on the day’s trading.
The interesting aspect to today’s trade was the weaker dollar when usually the dollar moves higher with higher Treasury yields and higher interest rates.
None of this is specific advice or a recommendation. Past performance is no guarantee of future results. Investing can involve the loss of principal, even over short periods of time. All NVDA EPS and revenue data is sourced from LSEG.
Thanks for reading.