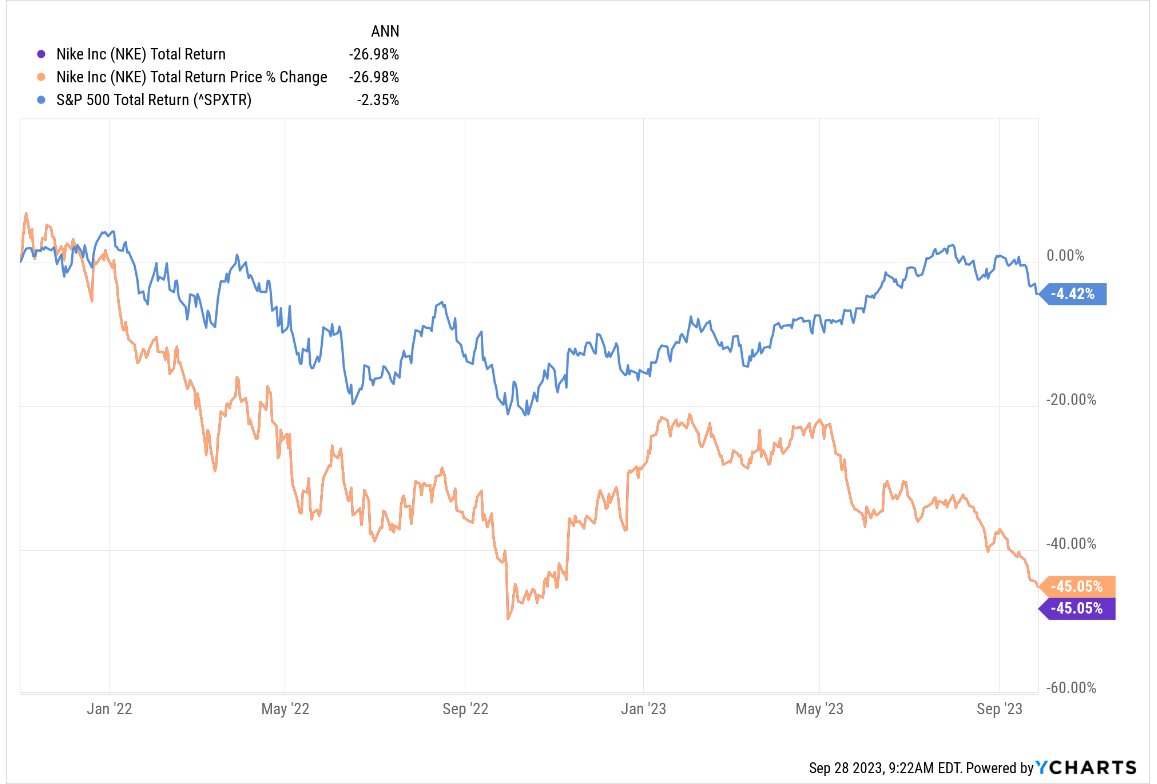
This chart of Nike relative to the SP 500 shows Nike’s underperformance since the peak in the stock in early November ’21.
Frankly this sell-off has been the best buying opportunity for longer-term buy-and-hold investors on the stock since March, 2020.
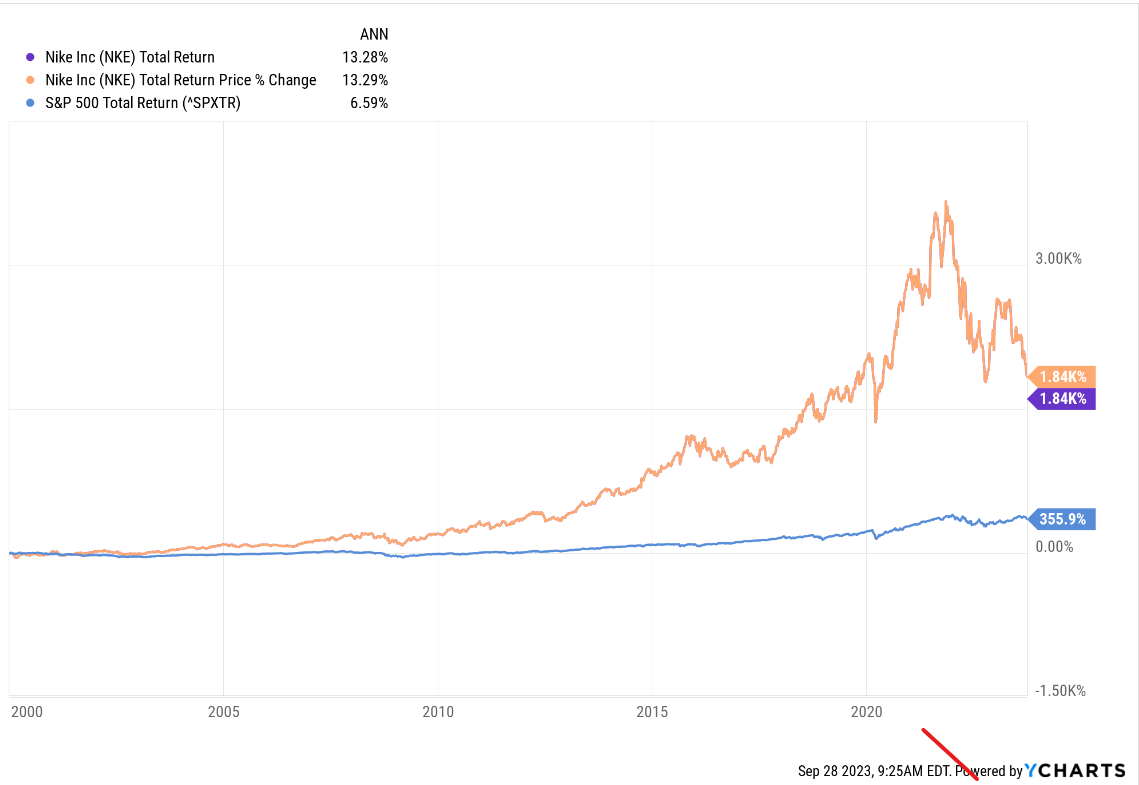
This is a longer-term chart of Nike’s performance vs the SP 500 (total return) as of January 1, 2000.
The low for Nike almost exactly one year ago on 9/30/22, was $82 per share, during the Q3 ’22 stock and bond market selloff’s following Jackson Hole in ’22.
How do NKE’s EPS and revenue revisions look ?
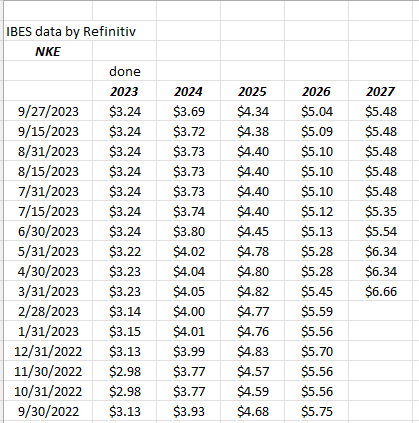
With fiscal ’23 in the books, and with investors looking at the first fiscal quarter of 2024 tonight. fiscal ’24 and ’25 EPS estimates have come down in the last 12 months, with fiscal ’24 EPS estimates declining 2.3% and fiscal ’25 falling over 7%.
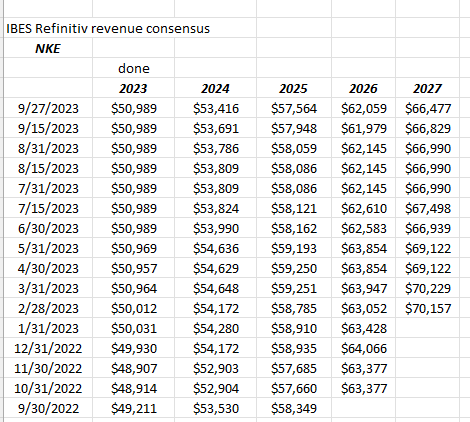
Fiscal ’24 revisions are actually up slightly in the last 12 months, wile fiscal ’25 revenue revisions have been revised lower by 1.3%.
(EPS and revenue estimate revisions sourced from IBES data by Refinitiv).
When revenue estimates stay stable and EPS estimates see downward revisions that usually indicates a margin issue: let’s take a quick look at Nike’s historical operating margin performance:
- 4-qtr avg: 11.55%
- 12-qtr avg: 13.89%
- 20-qtr avg: 12.00%
- 40-qtr avg: 12.60%
May ’23’s fiscal Q4 operating margin of 9.5% was the lowest since May of ’20 or the pandemic collapse. During fiscal ’21 and ’22 operating margin was volatile and then eventually was pushed lower on inventory issues, supply chain issues and and the same “macro” that impacted so many other retailers.
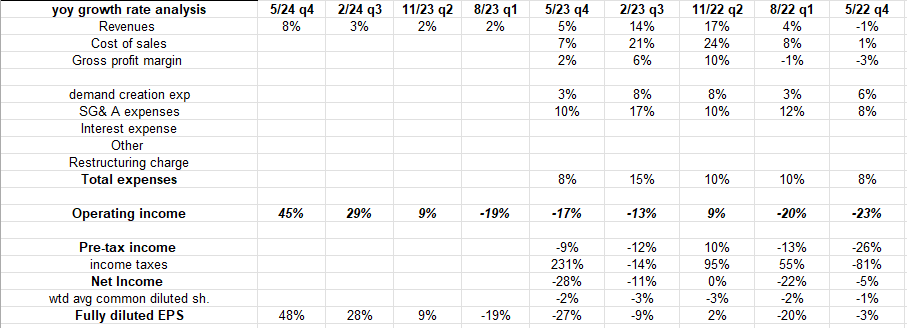
Here’s the last 5 quarters historical growth for NKE (across the income statement showing revenue, operating income and EPS growth) as well as “expected” revenue, operating income and EPS growth for the next 4 quarters based on current consensus estimates.
Nike is completing a tough streak of quarters with inventory issues, supply chain issues, wholesale problems, and the ever–present China worries. While the financial media has been focused on China, North America’s revenue growth has been quite spotty and volatile, probably due to supply chain issues, which are abating.
Fiscal ’24 does look better for the footwear giant.
Valuation metrics:
- 3-yr avg “expected” EPS gro: 16%
- 3-yr avg “expected” rev gro: 7%
- 3-yr avg expected PE: 24x
- Price to sales: 2.5x
- Price-to-cash-flow: 24x
- Price-to-free-cash-flow: 29x
- Free-cash yield: 3%
- Dividend yield: 2.5%
- Morningstar fair value est: $135
Summary / conclusion: For readers who are technically-oriented use the late September – early October ’22, low $80’s lows for the stock for your stop-loss if you want to buy ahead of tonight’s earnings.
Frankly, the pessimism and sentiment around the stock is as bleak as I’ve ever seen it in the last 10 years, and our valuation spreadsheet goes back to the late 1990’s.
All the worries appear to be about China in terms of the financial media, and stocks with considerable China operations like Nike, Starbuck’s and Boeing (for Nike China represented 14% of Nike’s total 5/23 fiscal Q4 revenue and 43% of Nike’s consolidated EBIT) have traded lower the last few months on somewhat generic “China concerns”. Normally earnings previews are written over at Seeking Alpha but in the May ’23 earnings preview, one of the Seeking Alpha editors had a problem with this blog’s “regional revenue and EBIT disclosure” spreadsheet listed in the preview, which was taken right from the fiscal Q3 ’23 or February ’23 earnings report (and sourced from the earnings report). Apparently a reader complained – which is understandable – but Nike reported their “Global Brand Division” revenue in fiscal ’23 at just $58 million with an operating loss of $4.8 billion. This does seem odd, but Nike does report regional revenue and EBIT thus all the region’s revenue and EBIT have to sum to 100%, leaving the Global Brand Division probably reporting a loss as necessary for overhead cost allocation (that’s my opinion) and leaving the numbers looking bizarre.
What’s the Nike secret sauce over the years, leaving the stock dramatically outperforming the SP 500 over the last 23 years ?
Well, in one metric it’s likely Nike “return-on-invested capital” since it’s truly a global brand and yet doesn’t have the capex of traditional global brands. Nike’s “capex” as a percentage of Nike’s revenue is just 1% – 2% the last 3 – 5 years, even Apple’s capex is higher at 3% of revenue, but Apple has that iPhone hardware which makes it a little more of a “capital intensive” business. Coca-Cola’s ROIC is similar to Nike’s i.e. in the low 30%’ ish range in the last 8 quarters or so, but up from the high teen’s low 20% ‘ish range in 2019 – 2020. The spinoff of Coke’s bottling operations in 2013 was designed to help the soda giant’s capital returns.
It’s hard to find good, reliable numbers on ROIC for any company – not just Nike – but my internal spreadsheet has Nike’s ROIC above 30% (using NOPAT or the traditional calculation) versus Apple’s ROIC, which is grossly distorted by the cash balances (which is subtracted from capital in the traditional ROIC calculation), and substantially larger than Nike’s 30%’ish ROIC.
The average industrial stock averages mid-single-digits ROIC, which readers can probably understand, given the capital intensity of a global manufacturer.
Nike’s is compelling here for longer-term investors, and I think the sentiment has really gotten dour on the stock in the last few months. Nike faces easier comp’s going forward and is trading at 24x forward earnings over the next 3 years, expected to average 16% EPS growth per year. (Clients currently own a 1% position in the stock, with the intent to add to shares on weakness.) Based on the valuation, Nike is probably trading around 15% too cheap to fair value, which may not be enough margin-of-safety to entice a wide swath of value investors, but the GARP (growth-at-a-reasonable-price) crowd should take notice.
Thanks for reading.