Overbought market:
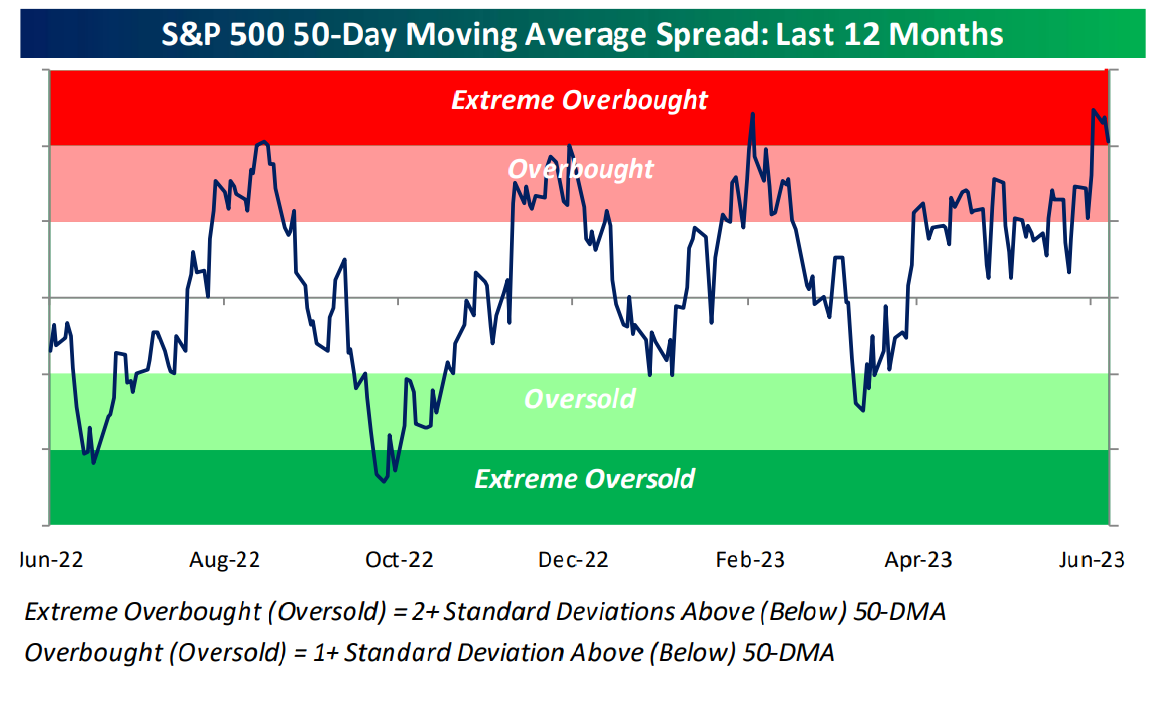
Technically the SP 500 is now in “extreme overbought” range per this weekend’s Bespoke chart.
SP 500 Earnings Yield:
It’s a metric that occasionally gets tossed around in the plethora of blogs and weekend reading, but the SP 500 earnings yield (EY) is quickly dropping towards 5%, which is a level at which investors want to start paying attention.
The 5% level is usually the level that signals the SP 500 needs a good flush, or correction, to reset the bar.
Here’s the trend in the SP 500 earning yield in 2023:
- 6/9/23: 5.25%
- 6/2/23: 5.27%
- 5/26/23: 5.34%
- 5/19/23: 5.35%
- 5/12/23: 5.45%
- 5/5/23: 5.47%
- 4/28/23: 5.42%
- 3/31/23: 5.37%
- 2/24/23: 5.58%
- 1/27/23: 5.54%
- 12/31/23: 5.81%
- 10/14/22: 6.50%
- 6/17/22: 6.42%
In late 2022, the EY hit 6.50% the week ended 10/14/22, and then again hit 6.42% the week of 6/17/22, both major lows for the SP 500 last year.
In early Feb ’22, the EY traded between 4.50% and 5% thanks to the elevated SP 500.
The EY is a broader market-timing measure. A drop in the EY below 5% will definitely get attention, but a good flush often fixes it, and doesn’t necessarily indicate a prolonged bear market.
Fundamentals and technicals are aligning to tell investors the SP 500 is getting extended.
Fed funds range:
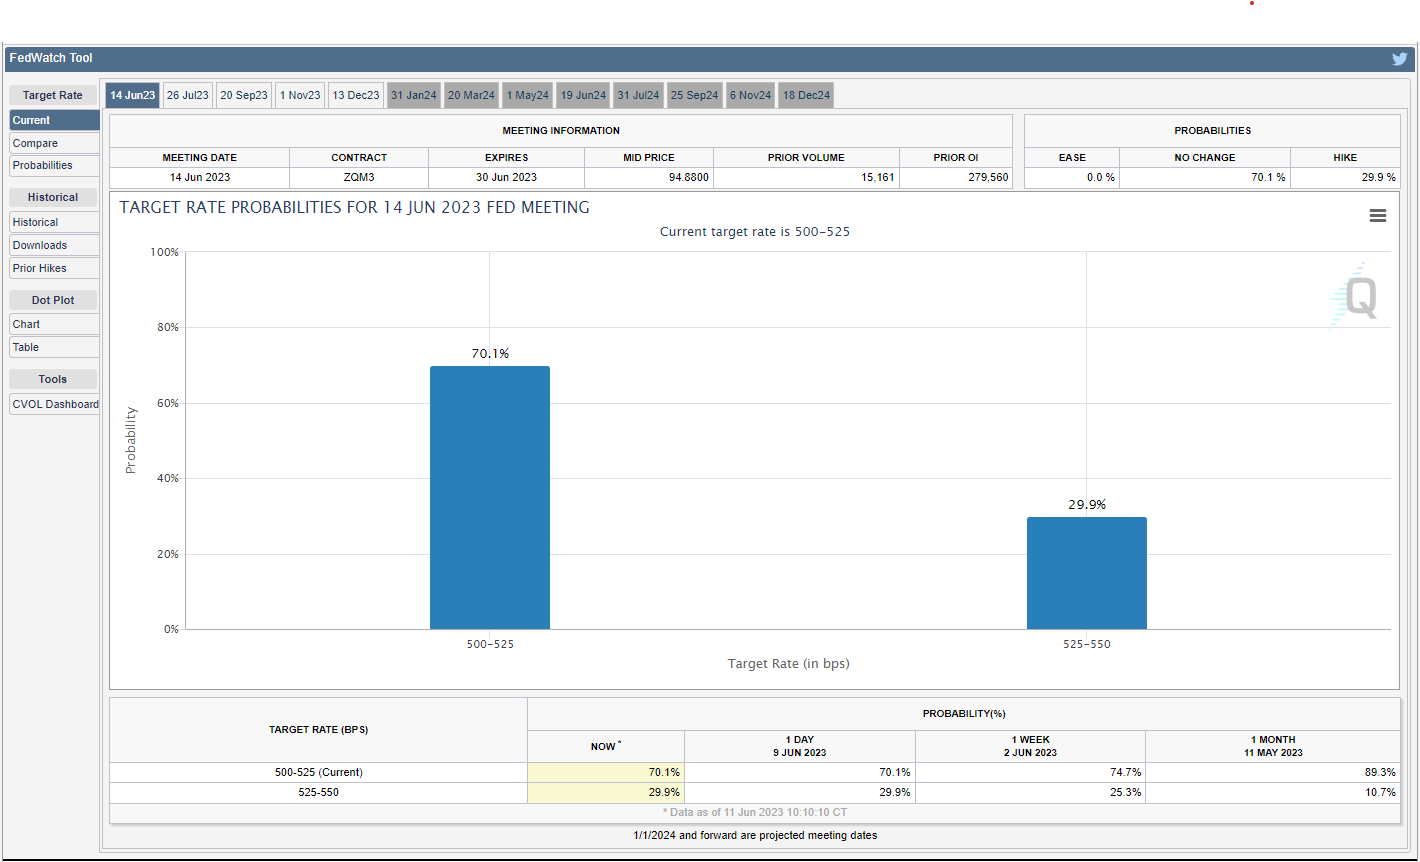
With the FOMC meeting Wednesday, June 14th, all eyes are on the 70% chance of no hike in fed funds this week. Note how the probability of a 25 bp hike for July ’23 continues to edge higher.
The reason for the FOMC pause could be the T-bill issuance around the Treasury’s refilling of the TGA (Treasury general account). Mike Zaccardi, a frequent publisher of his work on Twitter (@MikeZaccardi) and whose work is first rate (in my opinion) posted a note from Bank of America this week, noting that the TGA replenishment by the Treasury is the equivalent of a 25 basis point hike anyway.
Watch the July ’23 fed funds range probability. That’s the key.
May CPI, PPI this week:
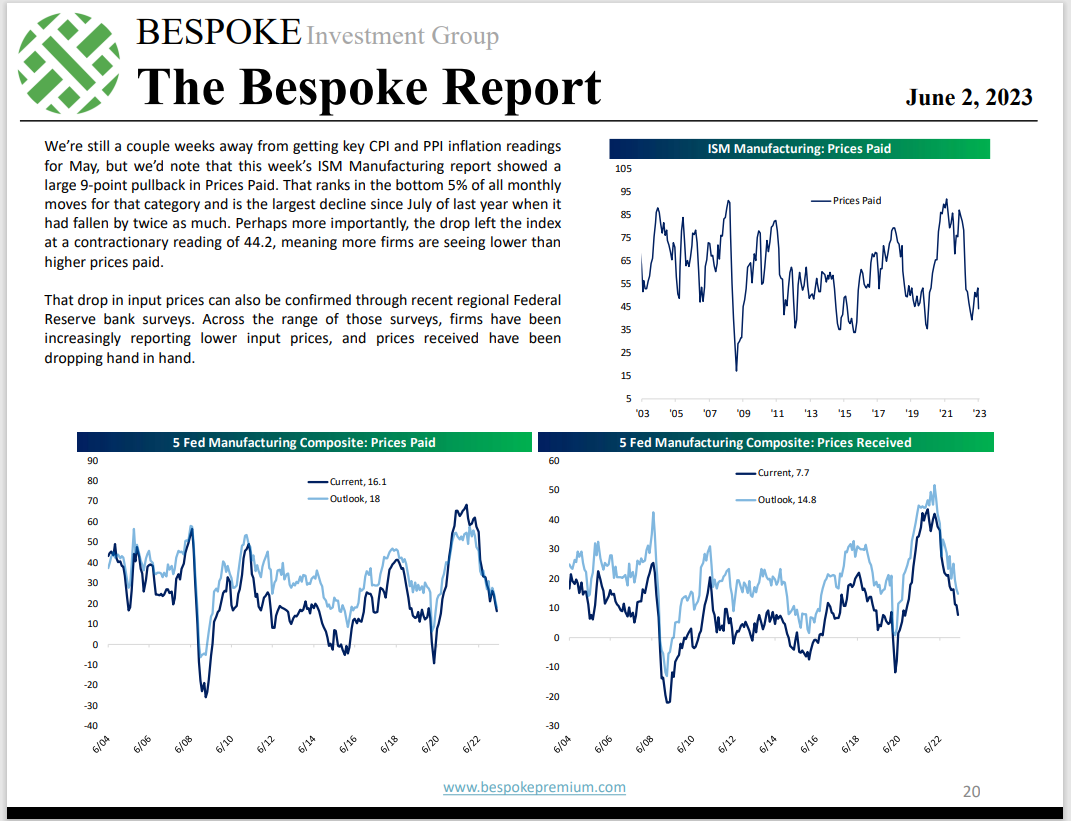
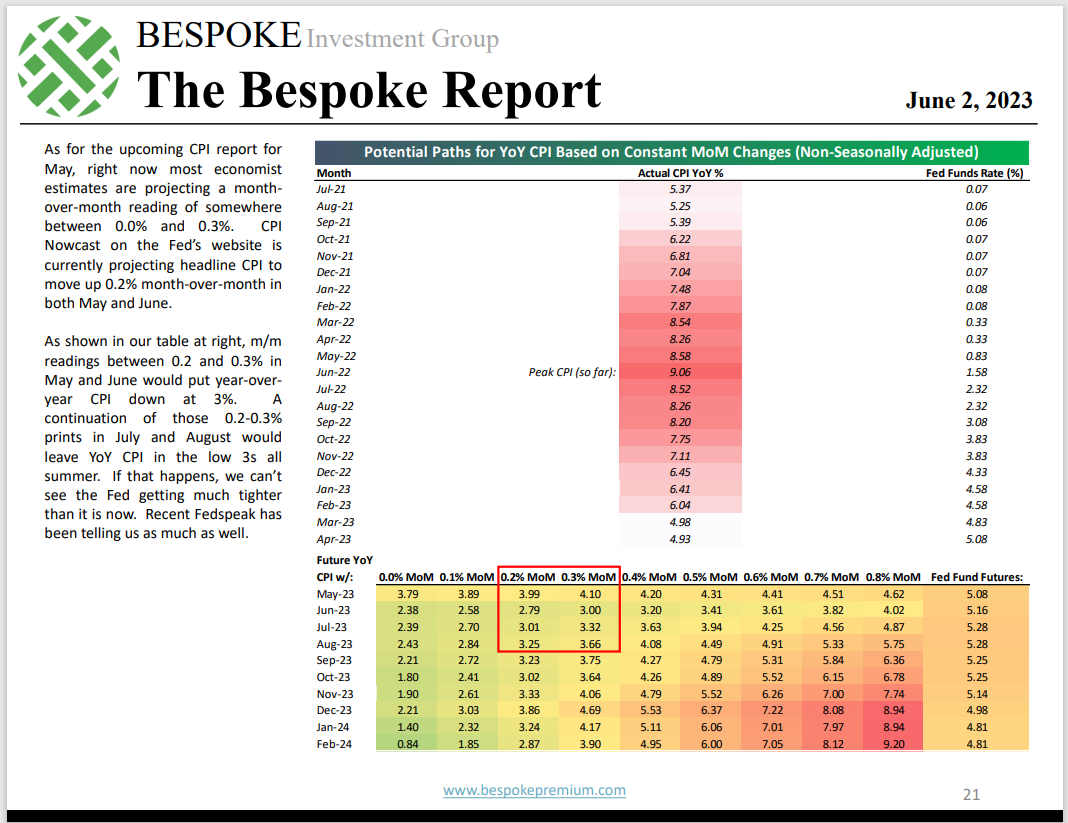
These two pages from the Bespoke Report of last week, June 2nd, perfectly explain the math around the CPI, and PPI data this week. Even slightly higher-than-expected prints this week on Tuesday (May CPI) and Wednesday (May PPI) would not derail the downward pressure on the fixed-weight indices.
The way I read the bottom of p.21 is that even if CPI is +0.4% this week, the CPI still comes in at 73 basis points better (y.y) at 4.20% than April’s 4.93% rate. (These tables from Bespoke are greatly appreciated but I wish Paul Hickey and the crew would do something similar with the PCE deflator’s “services” measure.)
While fixed-weight inflation measures are helpful, it’s the deflator – and in this case the PCE deflator – that has the Fed / FOMC’s attention.
SP 500 data:
- The forward 4-quarter estimate (FFQE) declined one thin penny this week ot $224.49 from last week’s $224.50;
- The PE estimate on the forward estimate is now 19x
- The SP 500 earnings yield dropped this week to 5.25%, all of which was covered above;
Rate-of-change:
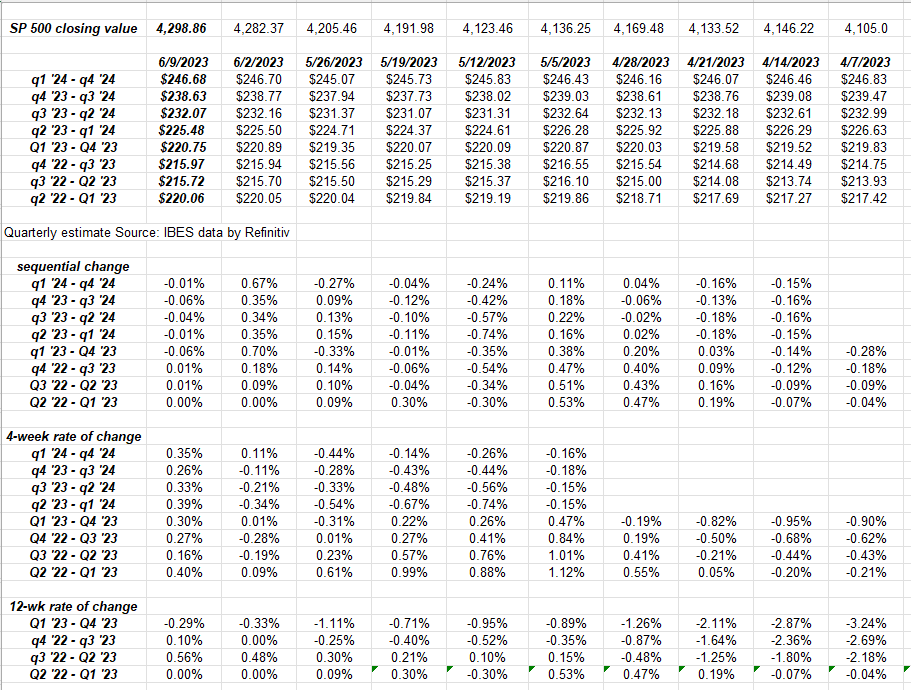
Readers need to look at this data as much as I do, but the lesson in today’s table is that downward pressure on the forward estimates along the “SP 500 earnings curve” has all but stopped.
That’s unusual at this time during the quarter. Analysts are still usually looking for reasons to trim numbers ahead of Q2 ’23 earnings.
Those first rows of numbers are the bottom up, quarterly EPS numbers summed for each quarterly bucket going out through 2024. Rather than just annual SP 500 EPS estimates – which can suffice for valuation purposes – the earnings curve gives readers more precise insight into actual earnings estimates.
Summary / conclusion:
Over the next few weeks, investors get insight into a broad swath of the SP 500 and the economy with earnings releases from Oracle (ORCL), and then in the next two weeks, FedEX (FDX), KB Home (KBH), Nike (NKE), Accenture (ACN) and then Micron (MU Technology, the last week of the quarter. While Micron isn’t Nvidia, it’s a good look at the DRAM and NAND markets both from a supply and demand perspective, and the semiconductor sector has been leading since last October ’22’s low.
The smoke signals are lining up to indicate the SP 500 is getting pretty overbought, but worries over a large pullback seem exaggerated. It’s fascinating to read all the recession prognostications for well over 18 months now, and yet pressure remains on higher Treasury yields. The labor market seems like it could be the last shoe to fall, so don’t forget jobless claims coming out Thursday morning, June 15th.
If the CPI and PPI data comes in better-than-expected, it will continue to give the FOMC inflation hawks more reason to constrain their hawkish monetary policy instincts.
Take all this with a grain of salt. None of what’s written on this blog is to be construed as investment advice, and past performance is no indictor or predictor of future results. Capital markets change quickly for both the good and the bad. Be sure and gauge your own personal appetite for market volatility.