Quite a bit happening this week: there is the March ’23 CPI and PPI data coming Wednesday and Thursday of this week, April 12th and 13th, and if that isn’t enough Blackrock (BLK), JP Morgan (JPM), Citigroup (C), PNC Bank (PNC) and Wells Fargo (WFC) all report Friday morning, April 14th, before the opening bell.
The day-by-day economic releases for this coming week are found below, cut-and-pasted from Briefing.com:
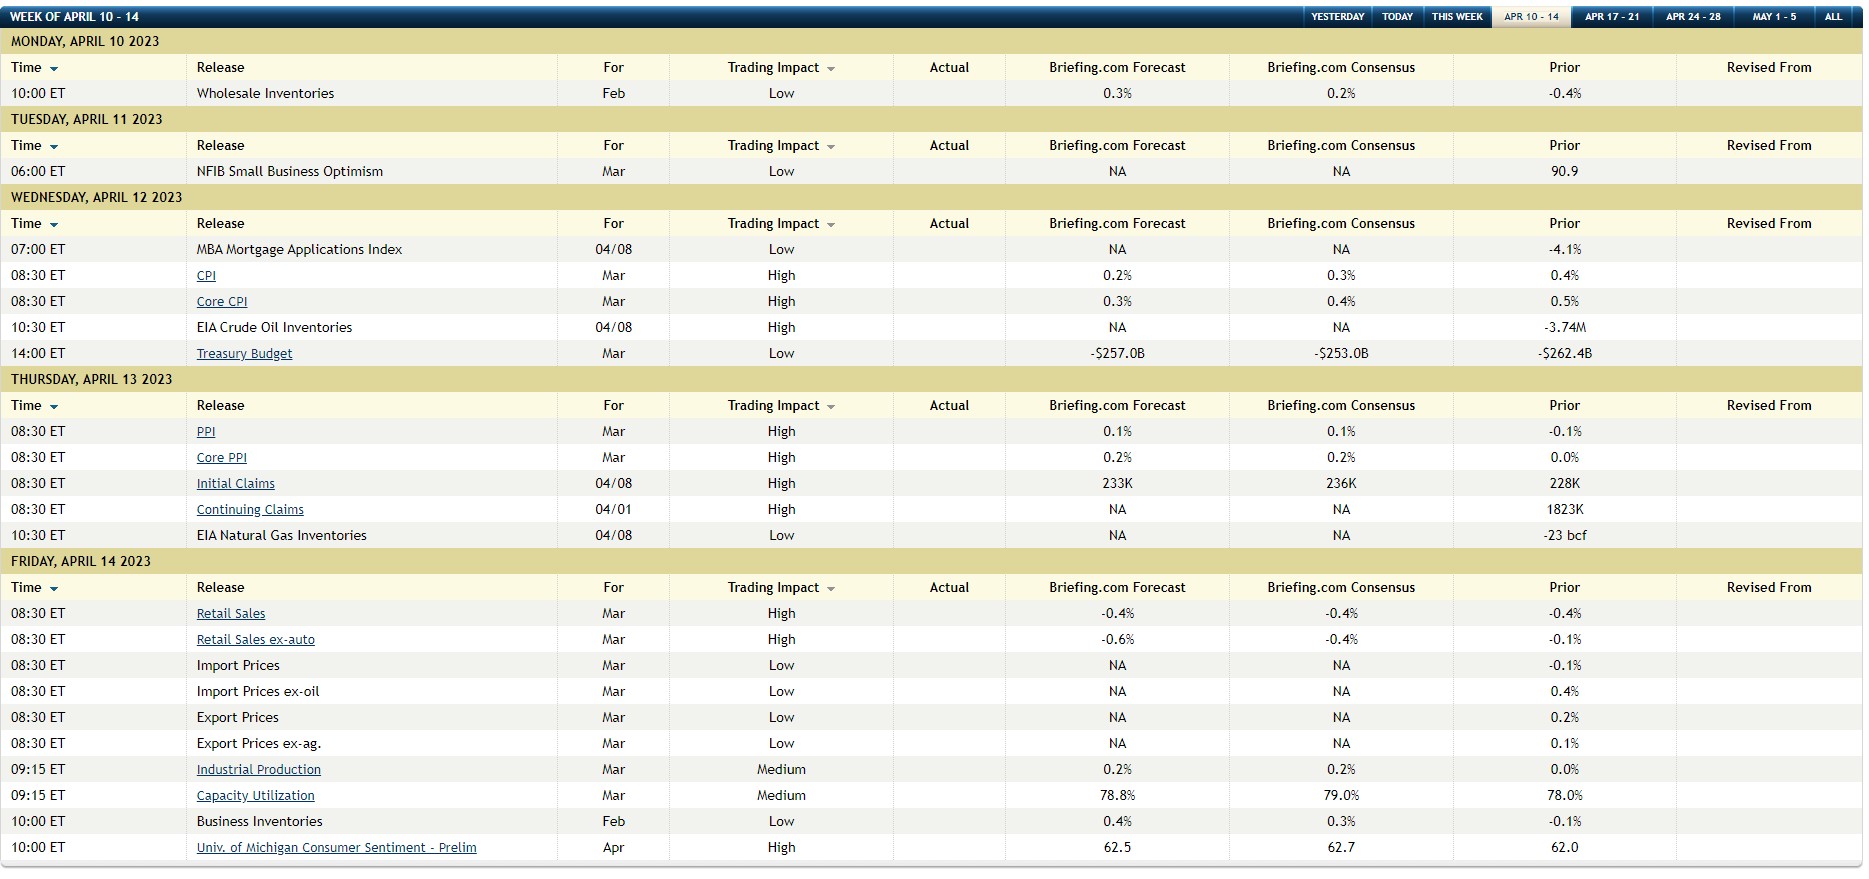
Here’s a quick summary of Briefing.com’s economist “consensus” for the inflation data:
- March ’23 CPI: +0.3%
- March ’23 Core CPI: +0.4
- March ’23 PPI: +0.1%
- March ’23 Core PPI: +0.2%
SP 500 data:
- The forward 4-quarter estimate (FFQE), jumped to $226.64 this week, from last week’s $220.49, the increase consistent with the “quarterly bump” that occurs every 90 days when a new quarter is added, and the quarter just reported falls away;
- The new FFQE contains the sum of the quarterly bottom-up EPS estimates from Q2 ’23 through Q1 ’24, while last quarter’s FFQE’s period was the sum of Q1 ’23 – Q4 ’23.
- The PE ratio this week is 18.1x versus last week’s 18.9x;
- The SP 500 earnings yield is 5.52% vs last week’s 5.37%;
- The expected quarterly bottom-up estimate for the SP 500 is $50.63, which is quite low relative to Q4 ’22’s actual EPS of $53.16 and Q1 ’22’s year-ago compare of $54.80.
Every year at this time, i.e. the first week of April, Refinitiv updates the earnings data and adds the quarterly bottom-up estimates that have been missing from 2024 data the last year, and then adds a 2025 EPS estimate to the data.
Here’s the SP 500 EPS estimates and expected annual growth rates – per the latest Refinitiv data – for 2023 through 2025.
- 2025: $275.27, +12% expected y.y growth;
- 2024: $246.83, +12% expected y.y growth;
- 2023: $219.83 + 1% expected y.y growth;
Here’s the trend in expected 2023 SP 500 EPS growth for the last year:
- 4/7/23: +1%
- 12/31/22: +4.4%
- 9/30/22: +7.8%
- 7/1/22: +9.3%
- 4/1/22: +9.8%
Summary / conclusion: Anyone who was even tangentially involved in the stock and bond markets in 1989 – 1993, remembers the Greenspan-labeled credit crunch that was a function of the passive income loss removal as dictated by the 1986 Reagan Omnibus Budget Bill. Only Jim Chanos and Brian Wesbury still write about those days. Basically, what followed after the 1987 stock market crash, and the high-yield debt collapse of ’87 – ’88, precipitated what turned out to be the largest number of bank failures in US history, far more than 2008.
The aftermath or fallout from the early 1990’s credit crunch was three-fold:
1.) Securitization exploded, since banks were capital constrained and what started with MBS or mortgage securitization, evolved into (by 1993) credit-cards, auto-loans, farm-equipment, and even aircraft leases. Securitization helped take the pressure off bank capital ratio’s and allowed for banks to extend loans, then off-load assets.
2.) REIT IPO’s also exploded. In the 1980’s, REIT’s were these kind of one-off “passive-loss income” generators for larger portfolios, bought with a “let’s hold our nose mentality” and it was primarily all bank lending. The credit crunch of the late 1980’s, early 1990’s, shut off or sharply-curtailed REIT’s access to capital from banks, thus REIT’s had to turn – for the first time ever – to the public capital markets for capital, and thus right after the start of Gulf War I in early 1991, and with the Fed cutting rates, REIT IPO’s and debt issuance soared;
3.) The yield curve wound up positively-sloped for years (short rates lower than longer maturities, which is how it normally should be sloped) which led to the big Wall Street firms Bear Stearns, and Goldman and others printing money in the MBS business, only for all this to come home to roost in the 2000’s (mainly 2008);
So what’s the point ? Although bank lending – per the early reports after data was released on Friday April 7th, 2023 – was shown to have contracted by the largest amount on record – $105 billion – that could be the deceptive since it doesn’t give a percentage. It’s still a contraction – which is something we’d rather not see – but will it be sustained and for how long ? The Fed’s discount window was expected to relieve the pressure of held-to-maturity unrealized losses in bank securities portfolios.
It’s still too early to tell. My initial take is that talk of a real “credit crunch” like the early 1990’s is still a low probability. However, what is becoming clear is that the dominos are lining up for Jay Powell and the FOMC to reverse themselves on monetary policy, clouded by a still decent March ’23 nonfarm payroll report on April 7th, 2023.
The jobs data was the last man standing (to turn a phrase, so to speak) and it looks like it’s starting to roll over, although more evidence is needed. All the inflation metrics continue to fall on a year-over-year basis.
![]()
This take by Goldman on expected Q1 ’23’s SP 500 earnings breakdown by sector, readers might find helpful. Here was this blog’s take on Q1 ’23, both here and here, last week.
Reading Bespoke’s work over the years, typically when sentiment is this bearish, coming in an earnings season, it usually bodes well for both the SP 500 and the earnings results. However, I haven’t seen Bespoke’s preview (yet) of Q1 ’23 earnings.
Individual bank earnings previews, will be coming throughout this week.
(Take all this with substantial skepticism, and a considerable grain of salt. It’s one person’s opinion, and past performance is no guarantee of future results. Capital markets can change quickly, both for better and worse. The SP 500 earnings core data provided here is sourced from IBES data by Refinitiv, but any extrapolation or mathematics using the data is this blog’s responsibility.)
Thanks for reading.