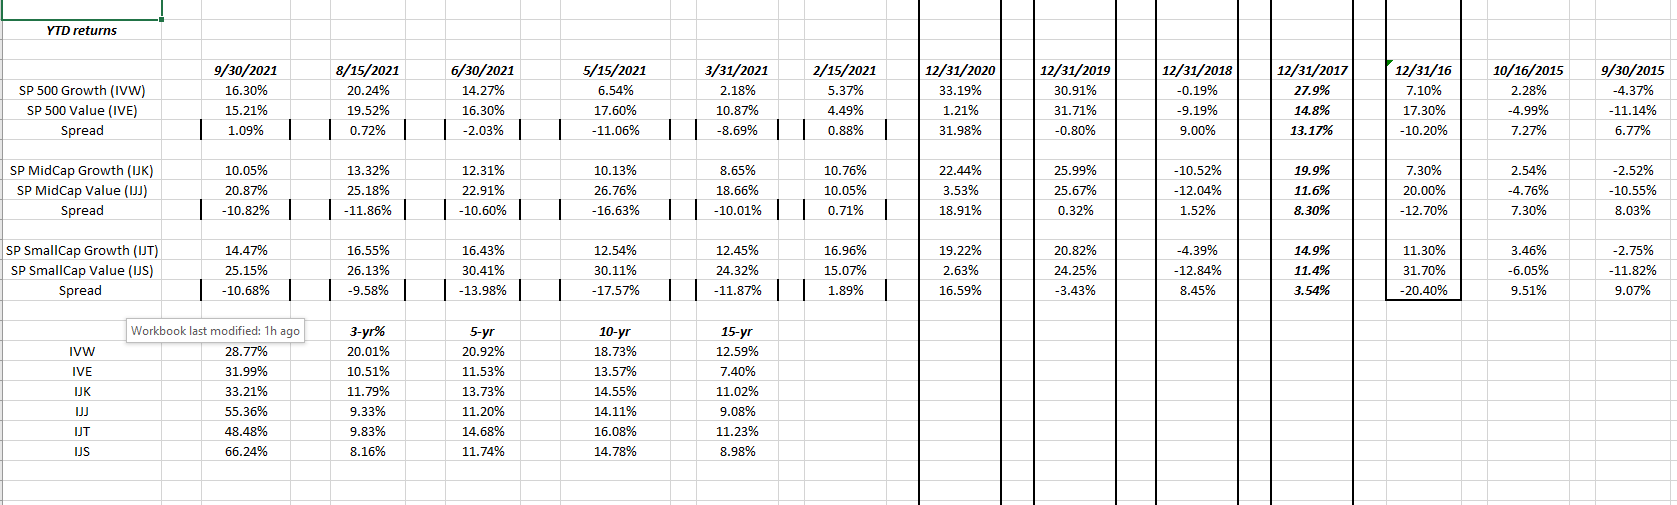
This blog updates the various market-cap (large, mid, and small-cap) and styles (growth versus value) every 6 weeks, so the above represents the YTD results and rolling 1, 3,5, 10 and 15 year time frames for the various style boxes.
The iShares ETF’s are being used but (not shown) is the various style boxes for Vanguard’s ETF’s all of which are close proximity to the iShares listed above.
Here’s a couple quick observations:
1.) All styles have fallen since mid-August ’21;
2.) In terms of absolute returns, mid and small-cap value continue to outperform their respective “growth” factors YTD, the first time since 2016;
3.) Only large-cap growth is beating large-cap value YTD, and not by much;
4.) If you want a good reason to be worried about this market, note the 1,3,5 and 10 year rolling returns of “large-cap growth” i.e the rolling 10-year return for large-cap growth is now 18.7% as of 9/30/21;
5.) In terms of the bond market benchmarks, corporate high-yield and TIPS have done very well this year, but are still seeing just mid-single-digit returns.
Summary / conclusion: Perhaps today’s “style box” post should have been entitled, “good reasons to be nervous over large-cap growth” particularly if you look at the rolling returns of the ETF over the last 15 years. Part of this is due to the fact that the decade from 2000 to 2009 was the worst since the 1930’s and a lot of that is the large-cap growth concentration in the SP 500. The last 11 almost 12 years have seen the big bounce in large-cap tech and growth.
The biggest change this year for clients was selling the Vanguard Emerging Markets ETF (VWO) which had numerous China companies in the top 10 and buying the EMXC or the emerging markets ex-China ETF. More homework is being done on international and EM ex-China, looking at “average, annual returns single-country ETF’s.
Finally here is a chart from LizAnn Sonders, Schwab’s chief strategist, on the Big 5 and their drawdowns this year:
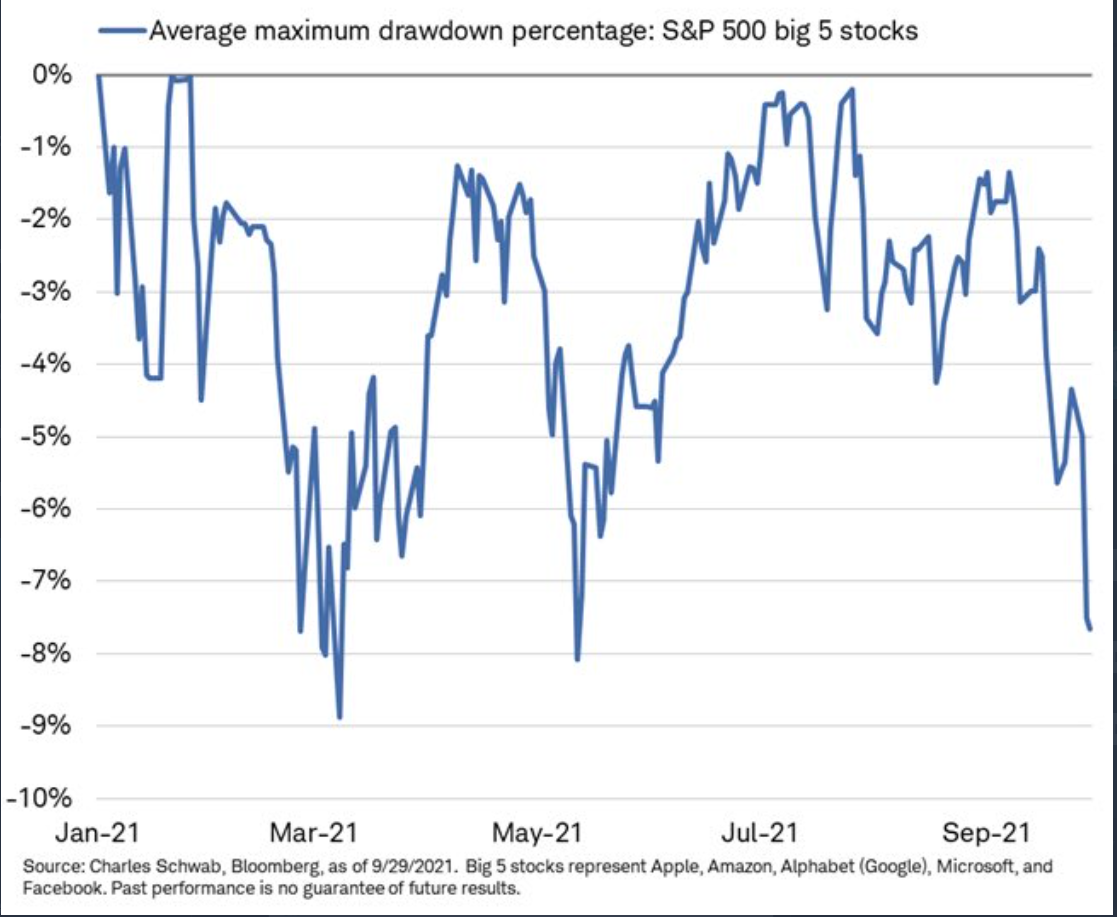
This chart represents Apple, Google, Amazon, Facebook and Microsoft drawdowns this year.
At some point large-cap growth will go out of favor and it could last a while.
Take everything you read with great skepticism. None of this is to be construed as advice, but the blog is used to formulate thinking and keep clients apprised of what’s happening in the market. Capital market conditions change quickly and positions and thinking aren’t always updated.
Thanks for reading.