Client meetings since January 1 have kept the blog posts at a minimum.
Two consistent questions from clients: 1.) How long can this last ? (i.e. SP 500 strength), and 2.) Is a recession coming ?
In my own opinion, a lot of this “client angst” is a function of the decade from 2000 to 2009, and then the worst recession of the Post WW II period in 2008.
And it wasn’t just the US seeing a deep recession in 2008, it was the fact that the SP 500 corrected 55% – 57% peak-to-trough, the credit markets including investment-grade bond funds, came apart, with junk yields hitting 25%, and maybe more importantly, single-family-housing, the biggest asset and wealth creator on most US consumer balance sheets, saw sharp declines in value as well, in the form of the first national US housing recession.
In the 2001 – 2002 recession, it was mainly the Nasdaq and “business investment” that suffered as post 9/11, the Fed cut rates sharply and housing and auto sales took off, indicating strength and confidence in the US consumer, post 9/11.
In 1990, it was a commercial-real-estate driven (and credit) driven crisis where 750 US banks failed (more banks failed than in 2008’s Great Financial Crisis) thanks to the passive-loss income removal changed by the Reagan Omnibus Budget Reconciliation Bill of 1986. The thing is single-family-housing stayed relatively robust throughout the late 1980’s and early 1990’s “soft landing”.
So what’s the point ? Personally, while the next recession could be tough, the expectation is we won’t likely see a repeat of 2008. That was a generational occurrence, basically the condensed version of the 1930’s Great Depression repeat for the Boomer generation of Americans.
Very few mainstream financial media pundits have noted that from the March, 2000, high for the SP 500, it took another 13 years, (April, 2013) for the SP 500 to make a material high above 1,550 – 1,575.
Now that’s a secular bear market.
And here’s the caveat:
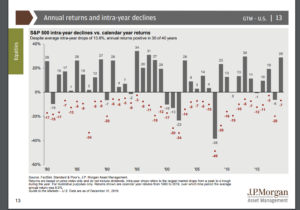
This table from JP Morgan’s December 31, 2019, “Guide to the Market” shows that – “on average” investors should expect a 13% – 14% correction every year.
This make a good case for against market timing. By the time any SP 500 correction turns out to be “greater than average” meaning that – like Q4 ’18’s 20% peak-to-trough” drop which was Fed-related – you’ve probably already seen the bulk of the decline. That’s a temptation I have to constantly fight personally i.e. the ability to sit and suffer through the angst of corrections.
In Tim Geithner’s book, “Stress Test” Tim made a remarkable admission about the Fed and FOMC: he said that when recessions begin, “The Fed starts pushing buttons” meaning they take action and then evaluate the capital markets response i.e. stock prices, credit spreads, liquidity, etc.
When corrections start, we just don’t know if it’s an “average” correction, 20%, 30% or on the edge of the Apocalypse like 2008 and the SP 500 corrects 55%.
SP 500 Earnings data (by the numbers): Source: IBES by Refinitiv
- Fwd 4-qtr est: $176.85 vs last week’s $176.81
- PE ratio: 18.9x
- PEG ratio: 5.5x
- SP 500 earnings yield: 5.31% vs last week’s 5.41% and still in the lower end of post-2008 range
- Y/y Growth of Fwd est: 3.43% vs last week’s vs last week’s 2.65%
It was somewhat unusual to see a sequential increase in the forward 4-qtr estimate since the typical pattern is that the forward estimate gets revised lower until the next quarterly bump. Let’s see if the pattern continues over the next few weeks.
Also, remember the “y/y growth rate of the fwd estimate” is the forward estimate today, versus the forward estimate 52-weeks prior. (The PEG ratio is derived from dividing the 18.9x PE by the 3.43% fwd growth rate).
Here is that “1-year chg %” that we told readers we’d keep them informed about:

Since the November 1 ’19 bottom in the 1-year chg %, the increase has been steady and measured. In and of itself that doesn’t always lead to higher stock prices, since 2019 was such a dramatic year of “PE expansion” but like the old saying about the fastest runner not always winning the race, it’s still good to see the forward estimate turn higher. This is telling us the 0% – 1% actual SP 500 EPS growth rate in 2019 is coming to an end.
Backward data:
- TTM 4-qtr est: $163.15 vs last week’s $163.08
- PE ratio: 20x
- PEG ratio: 2.4x
- SP TTM earnings yield: 4.90% vs 4.99%
- Y/Y growth: Fwd est / TTM est: +8.40% vs +8.36%
The bullet-pointed data above is forward looking (in the first series) and trailing-twelve-month’s data is the 2nd series.
Summary / Conclusion: The key metric in this week’s write-up is the Excel spreadsheet and the 1-yr chg %, which is the biggest change in the SP 500 data in the last 15 – 16 months. That being said, the next two weeks we will see the majority of the SP 500 reporting, and then by February 15th, the vast majority of the SP 500 will have reported their 4th quarter, 2019 and we will know what the SP 500 EPS growth was for 2019, which probably won’t change from the 0% – 1% being projected today.
The current estimate for expected 2020 SP 500 earnings growth (per IBES by Refinitiv) is 9.7%.
The key metric will be how SP 500 EPS growth rates change by sector for 2020, based on guidance being given in the conference calls the next few weeks.
There has been no change in the 9.7% expected growth rate for SP 500 earnings since January 1, which is actually a plus. Again, normally there is the natural trend to downward revisions over the course of a quarter, but the fact is we’ll have better insight about 2020 by the end of January.
Thanks for reading.
Client angst and sentiment is still indicating – from a sentiment perspective – we are nowhere near the euphoria of the late 1990’s.
My personal email is brianglm@trinityasset.com.