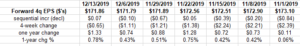
This “forward estimate 1-year chg %” continues to tell the right story thus it will continue to be shown every week, after bottoming the week of 11/1/2019.
That +0.06% -year change in the forward estimate on 11/1/19 was the smallest print for the metric since early to mid 2016.
Although it is still a little early to call, the 14 – 15 month compression in the 1-year chg in the forward estimate (perhaps only due to the tough comparisons to quarterly SP 500 earnings growth thanks to tax reform) looks to have finally ended.
For readers, the importance of this number is that it shows the “4-qtr fwd est” relative to the same estimate 52 weeks prior. Unaware of any other blog that tracks this metric, it gives the reader an idea of whether the PE on the SP 500 will expand or contract. The logic being that a forward estimate whose 1-year change is expanding – like the above spreadsheet – should indicate that the SP 500’s PE is more likely to expand than contract.
15 months ago, the “1-year % change” on the forward estimate peaked at 22.9% (thanks to tax reform) and coincidentally the SP 500 peaked that same week making a 2018 and all-time-high, and then we saw the 4th quarter, 2018 correction, where the SP corrected 13% in Q4 ’18.
Since the Sept 21 ’18 peak in the 1-year change in the fwd est, the PE on the SP 500 in the last 15 months has stayed in a range between 17 – 18. (The PE on the forward estimate for the SP 500 on September 21 ’18 was 17.32. Today, or rather as of 12/13/19, the PE on the SP 500’s forward estimate is 18.44.)
What the above metric really tracks is the “rate of change” of forward earnings, which you’d think would matter to investors.
Here’s the catch though: be wary of using it as a market-timing metric.
SP 500 data (by the numbers): Source: IBES by Refinitiv
- Fwd 4-qtr est: $171.86 vs last week’s $171.79
- PE ratio: 18.44x
- PEG ratio: 23.6x (calculated by dividend the 18.44x PE by the 0.78% y/y growth rate found two bullet points down)
- SP 500 earnings yld: 5.42% vs last week’s 5.46%
- Y/y growth of fwd est: +0.78% vs last week’s +0.43%
Trailing data:
- TTM 4-qtr est: $163.87 vs last week’s $163.89
- PE ratio: 19x
- PEG ratio: 3.78x
- SP 500 earnings yld: 5.17% vs 5.21%
- Y/y growth of fwd est: +4.88% vs last week’s +4.82% (calculated by dividing the 4-qtr fwd estimate by the 4-qtr trailing estimate)
Summary / conclusion: Readers might perceive a lot of thus earnings data massaging as “navel-gazing” and to some extent you are correct, but the data and the rate of change and the change in trend does provide useful information.
Readers have been told numerous times over the last 10 years, that with the typical downward path (negative revisions) to estimates as each quarter is approached is considered “normal”, looking for sector growth rates whose expected growth rates are positive, meaning that a particular sector’s earnings growth rate is being revised higher (while the general trend for the SP 500 and most sectors is lower), is a powerful tell.
When looking at “expected” 2020 SP 500 EPS growth rates, Consumer Discretionary is still seeing higher revisions for next year as the 4th quarter rolls on. This blog highlighted that sector here.
While there is always a “message to the markets”, don’t ignore the “message in the earnings data” too.
This week the metric that stood out is “Fwd 4-qtr estimate” which was higher this week, over last week. (See first bullet point).
The higher forward estimate is helping pull that “1-year change %” higher in the first paragraph’s spreadsheet.
This blog will be out (tomorrow) with the 2020 stocks and bond market forecasts on Sunday, December 15th, 2019. Take with a substantial grain of salt.
Thanks for reading.