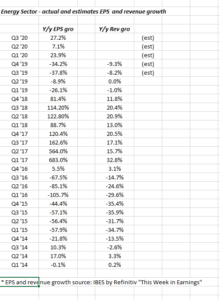
How much variance is there around y/y EPS and revenue growth in the Energy Sector ?
Here is the historical data:
With the news that the market cap of Apple (AAPL) at 4.5% is now greater than the entire market cap of the Energy sector (roughly 4.5%) a number of astute value investors have to be sniffing around the remains of the Energy sector looking for “cigar stubs”.
The pundits never mentioned that Apple’s market cap was bigger than the Basic Materials sector (3%) Utilities (3%) and the real estate sector (3%) as well.
And yet as of Friday, December 6th, Microsoft’s market cap is still bigger than all of them.
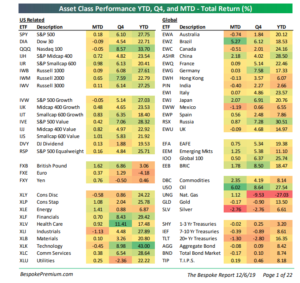
Crude oil is already up 5% month-to-date, per Bespoke.
Summary / Conclusion: In the above spreadsheet, between the two metrics, pay attention to revenue within the Energy sector. Small changes in revenue can lead to large changes in earnings growth for the sector, which typically means the sector has a high degree of operating leverage. Natural gas has had a horrible year. Looking at Bespoke’s YTD returns as of 12/6/19, natural gas was the worst performing segment this year, down 27%.
The positive European PMI’s last week, might indicate that 2020 would be stronger-than-expected for Industrials, and the Energy sector.
This blog has never been a big Energy sector investor. If we do take a position it will likely be a for a shorter time periods.
There are too many headwinds around the sector.
Thanks for reading,