We heard very little about this week’s Ron Baron forecast, where he predicted a 650,000 DJIA in 50 years. The math is simple as Baron detailed it: he assumed a 6.5% average annual return for the Dow 30 for a 17-year old at full retirement age or what i assumed is 67 years old, or 50 years from now.
This isn’t that unusual from Roger Ibbotson’s forecast in 1973 – 1974 (probably after the 50% SP 500 bear market, the only one seen in the post WW II period before 2001 – 2002) when Roger proclaimed the Dow 30 would hit 10,000 by the year 2000. (Thank you, Jeff Miller.)
It’s highly unlikely I’ll be around in 50 years, so enjoy your gigantic pot of money if you are 17 years old and plan to take action on Ron Baron’s prediction.
SP 500 data (by the numbers):
Last year, at this time, on Friday, November 2nd, 2018, per the IBES earnings data, the “forward 4-quarter SP 500 EPS estimate” (Q4 ’18 – Q3 ’19) was looking for $172.99, and 9% expected SP 500 earnings growth for the SP 500 while the bottom-up expected calendar 2019 estimate was $161.99.
Today, the expected 2019 SP 500 bottom-up estimate is $162.80 (or $0.81 higher than 52 weeks ago) and the “forward 4-quarter estimate” (Q4 ’19 – Q3 ’20) is expecting or predicting $173.10.
Here’s how the math falls out:
- Fwd 4-qtr est: $173.10 vs last week’s $173.94
- PE ratio: 17.7x
- PEG ratio: 279x (Yes, seems outlandish, but this data point was put back in for readers: the “fwd 4-qtr est” is just $0.11 higher than 52 weeks prior or 6/10ths of 1%. Relative to the 17x PE, 0.06% 279x)
- SP 500 earnings yield: 5.64% this week, versus 5.76% last week
- Y/y growth of fwd est: as stated above 6 basis points vs 40 basis points last week.
- TTM est: $163.59 bs $162.56 from last week
- PE ratio: 18.75x
- PEG ratio: 3.05x
- TTM SP 500 earnings yield: 5.33% vs 5.39%
- Y/y growth of TTM est: 5.81% vs 6.74% from last week. (The math is the “fwd est / TTM est”, so the faster the fwd est falls, the slower the growth will look over the TTM est. Hope that makes sense).
- Y/y growth of TTM est: 4% vs 4.35% from last week. (The math is the TTM est Q3 ’19 – Q4 ’18) vs the TTM est 52 weeks prior which would be Q3 ’18 – Q4 ’17).
Summary / conclusion: This SP 500 earnings data and growth expectations can get confusing as it’s laid out here. It’s completely my fault because of the confusion I’ve probably caused for readers. The one thing this blog does is calculate the “Fwd 4-qtr est” vs the same estimate 52 weeks prior: for me personally, it should provide readers with the SP 500’s ability to “expand PE” much like the measure of convexity does for a bond. The “fwd est vs the fwd est” is providing the “rate of change” for the forward estimate which again should give investors insight into the SP 500’s potential for PE expansion or contraction.
Readers and investors are hearing a lot of positives about Q3 ’19 “upside surprises” (i.e. beat rates) for SP 500 EPS and revenue, but the SP 500 is lapping the highest rate of earnings growth for the tax-cut aided Q3 ’18, which grew 23% y/y.
It’s 2020 that really matters right now: here is a look at the 2020 numbers from last night.
How does revenue growth look for 2020 ?
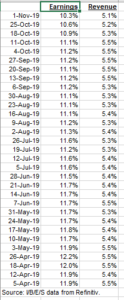
This was sent from IBES by TJ Dhillon on Friday afternoon, November 1, 2019.
Revenue growth expectations have remained relatively constant for the SP 500 for 2020.
Thanks for reading.