Energy is now just 4.5% of the SP 500 market cap weight, down from a high of 15% in September, 2014, when crude oil was trading around $80 – $100 per barrel and just before the commodity tanked to $28 per share by early, 2016.
It’s shocking what has happened to the sector.
Can’t recall where i saw the headline – possibly Bespoke – but Schlumberger (SLB) is trading close to 2008, early 2009 lows, while Halliburton bottomed in late 2008, early 2009, near $12 – $13 per share, and it closed Friday, August 30, 2019, at $18 and change. Schlumberger bottomed at $35 in late 2008, early 2009, and it closed at $32 last Friday.
The bizarre thing is crude oil is nowhere close to its January – February ’16 lows of $28.50, with NYMEX closing last week at $55, and Brent closing at $59 per barrel.
Financial sector estimates are acting similar to how Energy estimates acted in late 2016, early 2017, and that is making me nervous.
After crude bottomed in early 2016 at $28 – $28.50 per barrel, Energy estimates started to rise in May ’16 and so clients Energy weight was lifted to about 10% – 12% of accounts but then sold sometime in 2017. Despite positive revisions, the price action of the sector continued to be weak in 2017, thus the sector was sold.
Financial’s are giving off a bad and “deja vu” feeling about their earnings power much like Energy did after Q1, 2016.
Here is an update – as of 8/31/19 – on the revisions for JP Morgan’s EPS and revenue (per IBES data). JP Morgan was selected since its the 2nd largest Financial in the SP 500 and in the Top 10 market cap weights of the SP 500, after with Berkshire Hathaway (BRKB).
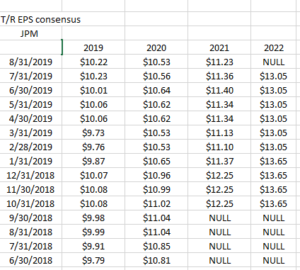
Readers can see how 2019 full-year EPS estimate revisions have remained positive since June 30, 2018, while 2020 and 2021 have weakened.
Let’s look at JPM’s forward revenue revisions:
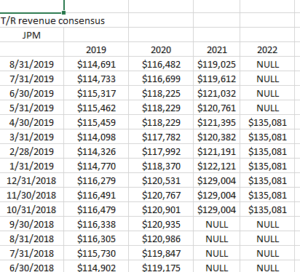
The 2019 – 2021 revenue estimate revisions have been downward for the last year.
Given JPM’s business model mix, with investment banking, capital markets, but substantial consumer and business lending areas, the banking giant really gives a good read on the major banks.
Summary / conclusion: Financial’s market cap weight within the SP 500 has fallen to 12.5% from 15% – 16% two years ago. It used to be closer to 20%, but that was when Real Estate was included in the sector, but Real Estate was spun out of the Financial sector a few years ago. Real Estate has a 3% market cap weighting today. The strong consumer should absolutely be helping the Financial’s and the major banks, but the negative revenue revisions are worrisome. Yes, the yield curve is a negative – particularly for institutions like Schwab and Northern Trust that are interest sensitive so if the FOMC cuts the fed funds rate again at the September ’20 meeting and the yield curve stops inverting, we’ll see how the Financial react.
The fact that Financials as a sector are expected to grow EPS 9% in 2019 – the best of all 11 S&P 500 sectors – and the sector can’t get off its back is worrisome.
Price action is everything.
Thanks for reading.