
The attached headline is from a Factset report dated August 12th, 2019, so with Friday’s “tariff tiff”, expect this only to get worse.
The SP 500 put in a double-bottom or made critical lows on the following dates in August ’19:
- 8/6: 2,822.12
- 8/7: 2,825.71
- 8/15: 2,825.51
- 8/23: 2.834.67
Most technicians would probably concur the price lows on 8/7 and then 8/15 constitute a double-bottom for the SP 500, so the action Monday will be critical after President Trump’s tariff retaliation after the market closed on Friday, August 23rd. Monday’s market open will be interesting.
Jeff Miller of Newarc Capital and a highly-regarded blogger at www.dashofinsight.com asked in this weekend’s article if worries about a recession can become a self-fulfilling prophecy ? Most readers would have to admit this market action and attention by the media isn’t a plus for the economy and the market. The constant talk of recession by the mainstream financial media you’d think would have some impact on the US consumer, if only marginally at first.
Finally, the Weekly Bespoke Report published every Friday afternoon, contained this chart which gives the right longer-term perspective:
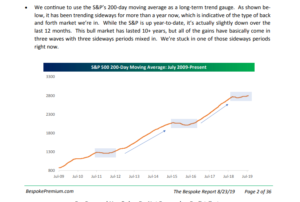
In my opinion this was a great chart since the description explains that the majority of the gains in the SP 500 have come in three periods (the most recent being Q1 ’16 through Jan ’18) which are then followed by longer consolidations.
If President Trump could insure a trade deal that addresses intellectual property theft (with a way to monitor such as President Reagan articulated with his “Trust but Verify” comment ) and if the deal could help improve security against the Huawei-type security threats, perhaps the President can declare victory and move on in the trade war.
The longer this lasts, the greater the “fatigue” factor and uncertainty factor looms for American business.
Personally I think the odds of a bear market and a US recession would increase if the headlines remain as they have the last 6 – 9 months.
Add to this the attacks on the Fed Chair, Jay Powell, and this is quickly becoming a mess.
SP 500 earnings data (by the numbers):
- Fwd 4-qtr EPS est: $171.77 vs last week’s $172.09
- TTM EPS: $164.39 vs last week’s $164.29
- Fwd PE ratio: 16.6x
- TTM PE: 17.3x
- PEG: 10.6x
- TTM PEG: 3.7x
- SP 500 earnings yield: 6.03% vs last week’s 5.95%
- Y/Y growth fwd est: +1.56% vs last week’s +1.71%
- Y/Y growth of TTM est: +4.49% vs last week’s 4.75%
Summary / Conclusion: The SP 500 earnings yield move over 7% during Christmas week in late 2018, and hasn’t really dropped much during 2019, so rising above 6% this past week shouldn’t mean that much, but I’m trying to look something / anything positive, in a very tough market.
P/E expansion is the hallmark of secular bull markets, so the lack of any growth in the “forward 4-quarter estimate” (which shows the growth expected forward earnings today, versus the same estimate 52 weeks prior) shows that the Street is still reluctant to boost forward estimates, even though bottom-up calendar EPS growth for the SP 500 still is still calling / expecting 11% – 12% growth in 2020. Comparing the “forward 4-quarter” estimate to the same metric 52 weeks prior tells us the “rate of change” of estimates and as that number rises, it should results in P/E expansion.
Tax reform makes for tough compares to 2018, but the “forward 4-quarter” estimate has fallen from 9% on Feb 1 ’19 to just over 1% today.
The “TTM est” shows the 4-quarter trailing SP 500 EPS divided by that “forward 4-quarter” estimate and is giving the growth rate more typical for investors i.e. projected vs actual.
Uncertainty slows down investment (i.e. capex) and risk-taking at the corporate level. Regarding China trade, which is between the two largest economies in the world today, it would be hard to believe any SP 500 CEO could move confidently without knowing what the rules are, from either side.
Throw Brexit into this mess – and the UK is the world’s 5th largest economy – and you basically have 3 of the world’s top 5 economies, whose politicians have to tell employers in their respective countries, “Hank on, we dont know what the new rules will look like yet.”
2,800 on the SP 500, which is the 200-day moving average, might be a big deal for the benchmark.
Thanks for reading.