Reading the headlines this week around the 800 point drop in the Dow, which was the largest point drop ever in one day, but – I think the source was Charlie Bilello at Pension Partners – who noted that in percentage terms – the same day was the 388th largest percentage decline for the Dow.
So, not that big of a deal.
The financial media talking about the 2’s – 10’s (Treasuries) curve inversion was almost laughable: per one source, the 2’s – 10’s inverted by 1 basis point in the morning but the spread closed the day positive by a basis point hence on a closing basis there was no inversion.
And yet that was the reason attributed for the 800 point drop in the Dow.
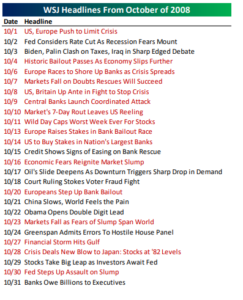
Reading Bespoke’s Weekly Report on Saturday, the 47-page end of the week (and one of the best) summary’s I’ve ever read of capital market, economic, technical and sentiment info in one source, bespoke noted these headlines from October, 2008:
But reading the Bespoke Report, i wondered what of the economic indicators were flashing red long before the Lehman Default and 2008 and Bespoke gave me the answer:
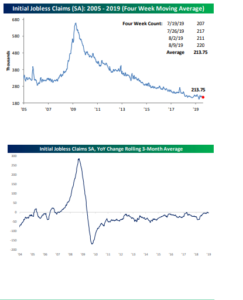
Reading Jeff Miller’s www.dashofinsight.com blog for years, Jeff likes the weekly jobless claims data for its frequency and consistency, and that data – if you look at the above jobless claims charts from Bespoke – shows taht jobless claims started to rise in 2007, well before the Lehman default and then peaked a few months after Lehman.
One thing is clear from last week’s economic data is that the US consumer remains strong, and the job market – at least when looking at jobless claims – is still resilient. It’s hard to think that jobless claims drop below 200,000 for an extended period, but the number has been locked between 200k – 220k for some time.
Jobless claims may not be getting stronger, but they really aren’t weakening either.
Finally, corporate high yield is down about 1% since August 1, a little surprising since we are seeing our first fed funds rate reductions in 10 years, but high yield spreads have hung in pretty well despite the recession worries. We remain underweight high-yield for clients, BUT we are slowly lifting the high-yield weighting as the Fed prepares for another rate cut in September ’19.
Summary / conclusion: Just like in 2008, the drop in the 10-year Treasury yield has everones attention, although it’s not yet being supported by other economic data. What’s even more bizarre is that inflation data this week came in stronger-than-expected, but it didn’t even phase the 10-year Treasury rally as labor costs came in hotter-than-expected (i.e. 3.4% vs 2.6% ?) and CPI was up sharply, although the economist consensus was looking for +0.3%.
Two really fascinating stats for readers:
1.) Per Rick Rieder, BlackRock’s CIO OF Fixed Income, who put in an appearance on CNBC this week: the “free-cash-flow yield” for the SP 500 is 4.75%, which is pretty healthy. It’s not a statistic you ever hear quoted for the SP 500, although this blog tracks it for all of our individual companies. (The free-cash-flow yield of the SP 500 and the SP 500 dividend yield are now both above the 10-year Treasury yield.)
2.) The SP 500’s high tick in late January ’18, was 2,872, and it closed Friday at 2,888, thus the SP 500 has gained 16 points in the last 18 months. Index holders have basically earned the SP 500 dividend, despite the market volatility.
To answer the headline question, I’d answer “no, definitely not”. Even if we do see an economic slowdown or recession, it would likely be a milder recession than 2008, since that was the worst recession for the US economy post WW-II. (Take every prediction and prognostication with a grain of salt. No one knows what the future looks like with certainty.)
The flat SP 500 the last 18 months is puzzling until you look at SP 500 earnings.
That will be addresses in the next few days.
Thanks for reading.