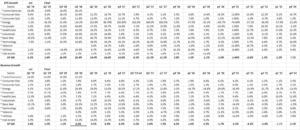
Source: IBES by Refinitiv sector data
Here is the historical EPS and revenue growth by sector for the SP 500, which helps us compare and contrast what went on in late 2015, early 2016, with today’s growth rates (or lack thereof).
- Expected revenue growth for Q2 ’19 is still positive albeit low single digits, while SP 500 revenue growth went negative in late ’15, early ’16.
- Energy and Basic Materials are both expecting y/y decline in earnings growth, although Energy as a sector is holding up much better than in early ’16, when crude oil fell to $28 per barrel in late January ’16.
- Technology earnings are negative in both periods: in mid-2015 China started devaluing the yuan, which impacted Apple, and Apple was going through a product transition as well, so what impact’s Apple, impacts Tech.
- The Communications Services sector hadn’t been created by early ’16 so it was still part of Tech back then.
- The biggest negative revision between early ’16 and Q2 ’19 is in the Consumer Discretionary sector, and within the XLY (Consumer Discretionary ETF), the biggest weights are Amazon (AMZN), Home Depot (HD) and McDonald’s (MCD) which comprise together 43% of the ETF, while Amazon is 23% of the total ETF. In late 2015, early 2016, Consumer Discretionary EPS averaged 17%, while “expected” EPS growth in Q2 ’19 is 0%. Revenue growth averaged 5.7% in Q4 ’15 through Q2 ’16, while the average revenue growth expected from Q1 ’16 and Q2 ’16 is 3.9% – 4%.
Summary / Conclusion: Michael Santoli of CNBC did a good job with a segment on Friday, July 15th, noting that SP 500 earnings expectations now as low as early ’16, but the sector data above will help in the similarities and differences. What may be more interesting for readers is that “compare’s” get easier for the SP 500 AFTER we get Q2 ’19 quarterly financial results, so keep an eye on Q3 and Q4 ’19 estimates.
Up 18% as of June 30, the SP 500 has had a good year already and is trading at an all-time-high this week, but the SP 500 itself is up just 4% – 5% from the Jan ’18 high of 2,872.87 and is up just 1% – 2% over the late Sept ’18 highs of 2,954.
It will be interesting to see what happens in the Consumer Discretionary sector, and what their financial results hold. (Long AMZN, far smaller longs in HD, MCD).
Thanks for reading…