My own opinion is that the SP 500 and the US equity market remain in a “secular” bull market that begin in either March, 2009, or April, 2013, when the SP 500 traded over – and stayed above – the March, 2000 and October, 2007 highs for the SP 500 of 1,550 – 1,575.
While like most people who invest money for a living, I do watch CNBC and Bloomberg, my own opinion is that the mainstream financial media does an absolute horrid job of informing listeners about investment issues, and that the need to sell advertising and to keep the machine running, results in “dramatic overreaction” to every data point and every market drop as if life itself hung in the balance. (Certainly not all of the financial news cycle is hyperbole, and in fact some is quite helpful, but – as one example – the drama associated with Fed meetings and the Federal Reserve itself and many other issues is quite amazing. Many of the Fed Governor’s had the economy wrong in 2007 and into 2008. One Fed Governor in July – August 2008 was still looking for better growth and was worried about inflation. Fed Governors are all treated like Moses coming down the mountain, and like everyone else they are using backward-looking data to draw their conclusions.)
While the media has somehow manufactured or blessed the notion that a 20% correction is a “bear market” maybe a better explanation – particularly when talking to clients – is that a “20% correction” is just that, and a market that makes a new high in the next 3,6 or 12 months as the SP 500 has done recently versus the late September ’18 high was not a reason to sell and generate sizable capital gains for taxable accounts.
Corrections are corrections: bear markets or rather secular bear markets are really a permanent impairment of capital usually for many years. For example, it took 6 years for the SP 500 to make a new high i.e. from it’s October, 2007 high of 1.575 to April – May, 2013, when it eventually and permanently broke out. Maybe a better example is the Nasdaq Composite, taking 16 years for the tech-laden benchmark to recapture its March, 2000, high of 5,132, during the month of July, 2016.
Let’s look at history quickly:
From late ’40’s to early ’60’s many think was the golden years after WW II;
1966 – 1982: Vietnam, Watergate, OPEC crisis, that was a tough 15 years. I believe the DJIA was range-bound for just about all of that period, with a 50% bear market in the SP 500 in 1974, the first for post WW II until the 2000 – 2002 period.
1982 – 2000: the mother of all bull markets. The emergence of Technology and Financial services as enormous job and wealth creators for individual investors.
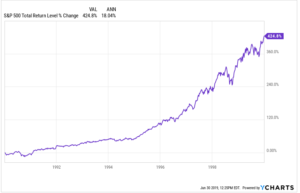
This chart shows what the decade of the 1990’s looked like in terms of the last half of that bull market.
2000 – 2009: The cumulative return for the SP 500 from January 1, 2000 through Dec 31 ’09 was 12.5%, for an average of roughly 1.25% per year for an entire decade. However contrast this with the large-cap growth and Tech frenzy of the late 1990’s where the cumulative return of the SP 500 was 125% for 1995 – 1999 (averaging 25% per year).
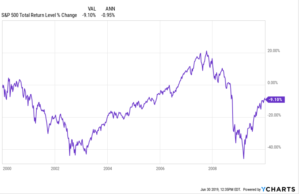
This chart using YChart software, shows the 10-year return of the SP 500 incorporating the decade with not one but two 50% corrections in the SP 500. There have been only 3 50% corrections in the SP 500 since the end of the Great Depression: the first occurred in 1973 – 1974, and that was around Watergate and OPEC, but the 2nd and 3rd occurred in 2001 – 2002 and 2007 – 2008. Two in one decade.
No wonder the individual investor is scared to death today.
2010 to present:
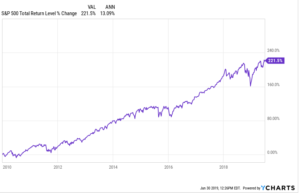
For the current 10-year bull market the average, annual return is pretty robust but not as great as the 18% for the decade from 1990 to 1999.
The one remarkable aspect to this present bull market that we’ve written about on this blog is that
1.) Market breadth remains very healthy
2.) Investor sentiment remains so poor. It is shocking how the major financial media news networks are populated with negative opinions about the US economy STILL, even after one of the worst 10-year periods for the stock market since the 1930’s.
Here is one final chart that might provide a little perspective:
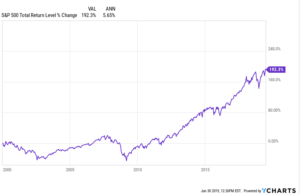
Looking at the 19 year period from 2000 through 6/30/19, the average return on the SP 500 is still below the 7% long-term average, even with the strong returns of the last 9.5 years.
Summary / Conclusion: By the mid-to-late 1990’s most investors had no idea what a bear market looked like or meant, and even then, the 1987 one-day crash was just that – a one-day correction. Then, you had a 10-year period from 2000 to 2009 when large-cap Tech and growth went nowhere and the 20-year laggards during the 1980’s – 1990’s bull market like gold, and emerging markets, and non-US, and commodities all had incredible 5 to 7 year returns driven primarily on the 15% annualized growth of China’s GDP.
The point is investors went from the highest highs of the late 1990’s to the lowest low by early 2009. Norm Conley, the owner of JA Glynn (now known as JAG Capital) in St. Louis, shot me an instant message or email in early 2009 and said that as of January 31 ’09, the rolling, 10-year return on the SP 500 was as low as the Great Depression. (That should have been one tell right there.)
Stay focused on the longer-term cycles.
My own opinion is that the SP 500 is still in the midst of a secular bull market, that could last a few more years.
Looking at the last chart above, the 19-year SP 500 chart – that long-term “average, annual” return is still below the post WW II SP 500 average of 8%.
The one area I’ve been wrong for clients since 2009 is expecting higher interest rates and higher inflation.
Today, with a 3.6% unemployment rate – about where unemployment was during the late 1960’s – we continue to see disinflation. The Fed is supposedly nervous with the “core PCE” deflator at 1.6%.
In late 2015, when Janet Yellen started raising the fed funds rate, I though the 10-year Treasury yield wouldn’t peak until about 4%.
Clients stayed in cash / money markets / T-bill’s for 2016 – 2018, and even in 2019, we are long some unconstrained funds but have kept portfolios with shorter durations.
There is more worth discussing on this topic, but it will have to wait for another time.
Take any longer-term forecast with substantial skepticism.
Thanks for reading,,,