The two US dollar proxies followed regularly are the UUP and the DXY. The UUP is a tradeable ETF, but it generates a K-1, therefore I stopped buying it for clients.
Both the DXY and the UUP have identical currency weightings:
- Euro: 58%
- Yen: 14%
- Pound: 12%
- Krona: 4%
- Franc: 4%
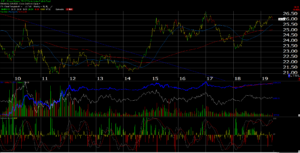
The dollar as measured by the UUP fell a little over 1% this week. The attached graph shows that despite recent dollar strength, the UUP failed to take out its early, 2017 high.
A weaker dollar would be – “net, net” a plus for the SP 500 in my opinion.
Roughly 1/3rd of SP 500 revenue is non-US. The dollar has been strong since early ’18, correlating closely to the flat SP 500 since then.
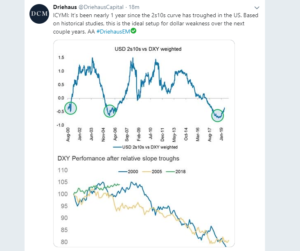
Driehaus (Chicago growth manager) posted this graph (above) to twitter this weekend, on the dollar. Wasn’t aware of this relationship.
Is it all “correlation without causality” i.e. the SP 500 being flat, the dollar being strong and the Treasury curve 2 – 10’s spread troughing ?
All else being equal, I’d rather see a gradually weakening dollar than a stronger one for the rest of 2019.
Dollar’s Impact on SP 500 Revenue
With a few weeks remaining in the second quarter, there are concerns in the market about the impact of trade tensions and slower global economic growth on companies in the S&P 500 with higher international revenue exposure. Given these concerns, are S&P 500 companies with higher global revenue exposure expected to underperform S&P 500 companies with lower global revenue exposure in terms of earnings growth and revenue growth in Q2 2019?
The answer is yes. FactSet Geographic Revenue Exposure data (based on the most recently reported fiscal year data for each company in the index) was used to answer this question. For this analysis, the index was divided into two groups: companies that generate more than 50% of sales inside the U.S. (less global exposure) and companies that generate less than 50% of sales inside the U.S. (more global exposure). Aggregate earnings and revenue growth rates were then calculated based on these two groups.
The estimated earnings decline for the S&P 500 for Q2 2019 is -2.3%. For companies that generate more than 50% of sales inside the U.S., the estimated earnings growth rate is 1.4%. For companies that generate less than 50% of sales inside the U.S., the estimated earnings decline is -9.3%.”
————————
In a timely post Factset’s John Butters quantifies some of the impact of the combination of the stronger US dollar the last 18 months, along with slowing global growth thanks to China’s rapidly-growing economy having slowed.
US companies with more than 50% of their revenue being non-US, will see an approximate 9% decline in earnings (expected) for Q2 ’19.
FedEx Corp (FDX) will report their fiscal Q4 (May ’19) quarter, later in June and their Q3 ’19 revenue was $3.4 bl from the US and $3.6 bl international. FDX’s stock is down from $270 in late January ’18 closing at $158.02 on June 7th, 2019. Thus, roughly half of FDX’s revenue is “non-US”. FDX is expected to show 3% y/y revenue growth generating a 16% drop in y/y EPS growth. FDX is lapping or comping a very strong May ’18 quarter where revenue grew 10% y/y and EPS grew 39%.
There is a lot of moving parts to FDX’s financials, i.e. Europe and their slowing economy (TNT acquisition), the dollar, and fuel costs. Clients are now long the stock with a 1 – 2 year time horizon.
Another example would be Starbucks (SBUX), of which 25% of SBUX quarterly revenue was China and EMEA directly, but the US revenue is somewhat-masked with the remaining being labeled “Americas”.
Still, the point being that the US dollar strength should impact SBUX less than FDX given the nature of the business and the degree of non-US revenue.
High-Yield Credit Market performance (YTD return source: Bloomberg Barclays):
- 6/7/19: 8.47%
- 5/31/19: 7.49%
- 5/24/19: 8.07%
- 5/17/19: 8.17%
- 5/10/19: 8.25%
- 5/3/19: 8.80%
Summary / conclusion: The high-yield bond market’s YTD return is almost back to the early May ’18 high, although the SP 500 remains below its early May ’19 high. The US dollar tends to strengthen and weaken in 12 – 18 month time periods, so if the dollar has peaked and will now trade flat to lower over the next year, it will be a positive for the benchmark, but the China tariff discussions will matter far more over the longer run.
There are still a lot of positives to the US stock market: SP 500 earnings are trying to bottom, the credit markets are still healthy, M&A is ongoing (Raytheon and UTX are in talks to merge, per the wires this weekend), however the strong rally in the 10-year Treasury yield has ignited recession worries. It is tempting to initiate a long in the TBF at these levels. Per Bespoke, the 10-year Treasury yield is 3.5 standard deviations below it’s 50-day moving average, a level “that has only been breached 13 times in the last 30 years”.
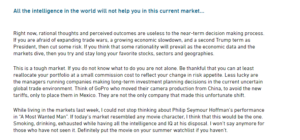
Blaine Rollins, CFA, the author of @361Capital’s excellent weekly blog, perfectly summed up trying to invest in this volatile market last week:
Thanks for reading.