Since the SP 500 peaked in late September ’18, the goal of the attached spreadsheet was to give readers a feel for the change in the EPS estimates for 2019, relative to the market action and change in the SP 500’s return.
The fascinating metric for me is that the Top 10 SP 500 market cap weights represent 22% of the benchmark by market value, and that’s been consistent since this blog has been tracking the Morningstar data.
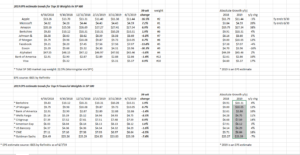
Since Jan ’18, the SP 500 is flat (the SP 500 peaked in Jan ’18 around 2,872, and closed at 2,875 this Friday, June 7th), and since Sept. ’18, the SP 500 is down a smidge from a capital gain perspective, but the 2019 EPS estimates for the Top 10 weights are looking for an arithmetic average of 8% growth this year, versus an expected growth rate of 3% for the benchmark itself.
Microsoft still looks the best in terns of EPS and revenue revisions, with their fiscal year ending 6/19.
Facebook (FB) and Exxon (XOM) have had the sharpest negative revisions since 9/30/18, and also are 2 of the 3 stocks that are looking for negative y/y EPS growth for calendar 2019, the other being Apple (AAPL).
Since Financials are a client overweight given their dividends and valuation, the top 9 Financial weights in the SP 500 have been tracked as well, in terms of expected 2019 EPS growth. What’s interesting is that Goldman Sachs is the only major Financial weight to show an expected decline in 2019 EPS growth and most Financials are expecting better-than-SP 500 earnings for this calendar 2019.
The Financial sector is definitely experiencing “P.E compression” last discussed here for the SP 500 as a whole. As noted in last week’s blog here, Financial sector EPS growt has actually strengthened since April 1, and yet the sector continues to trade poorly.
The last update on the “Top 10 Weights” was 3/31/19 found here, so this weekend’s update is a little later than usual.
Procter & Gamble (PG) has been working its way up the market cap ladder, with PG in the #11 spot and Bank of America falling to #12. Visa (V) remains in the #10 spot.
IBES by Refinitiv did not publish a “This Week in Earnings” update this weekend. The staff – David Aurelio and Tajinder Dhillon – were out of the office this past week.
Summary / conclusion: Microsoft has returned to juggernaut status as it has regained the #1 market cap position in the SP 500 after it spent 16 years trading below its January, 2000 high of $53.81. Microsoft has been clients #1 position since 2013 – 2014 when Satya Nadella was named CEO and Microsoft started focusing on the Cloud, unfortunately clients #2 weights has been Charles Schwab (SCHW) and that position has been a drag on performance the last 18 months.
Here is the point for readers: the top 10 – 15 weights in the SP 500 are the benchmark.
“Value” as an investment style had a good week this week: the SPYV (SP 500 Value ETF) returned 4.95% vs the SPYG (SP 500 Growth ETF) returned 4.04%.
Value has been out of favor for a while – in terms of relative performance, if “Value” starts to outperform, it might benefit Financials and if small and mid-cap start to outperform, the Top 10 of the SP 500 may tread water.
Thanks for reading.