The SP 500 earnings yield was 6.05% as of Friday’s close, and the 2nd week in a row where the key benchmark’s earnings yield was above 6%.
There was a string of 22 consecutive weeks from October 5th, 2018 to Feb 22nd, 2019, where every week the SP 500 earnings yield was above 6% and even above 7% on December 21st, so don’t use the EY as a timing tool, but the metric does indicate that the SP 500 is relatively cheaper once again.
SP 500 Earnings data (by the numbers -Source: IBES by Refinitiv)
- Fwd 4-qtr est: $171.60 vs last week’s $171.76
- PE ratio: 16.5x
- PEG ratio: 3.48x
- SP 500 earnings yield: 6.07% vs last week’s 6.01%
- Year-over-year growth of fwd estimate: 4.73% vs last week’s 4.85%
Summary / conclusion: To be frank with readers, the SP 500 Earnings yield was between 6% – 7% in 2007 and 2008, but the 2008 Financial Crisis was not an earnings recession, it was a “rotting from within” of our mortgage and housing financing, which is not an excuse to disregard the 2007 – 2008 data, but it’s a reality test for today.
On the daily chart, the SP 500 is about 3/4th’s of the way to “oversold” status, but the key benchmark remains above the 200-day moving average, unlike the decline in Q4 ’18.
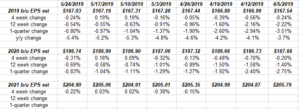
Since this blog has spent the last few weeks talking about the “4-week change” in the 2019 and 2020, this last week the 4-week change turned back negative.
Don’t like to see that.
However, note the 2020 estimate – that is 12% expected growth next year. Readers will laugh, but don’t ignore that longer time horizon.
Will be out with more posts over the weekend.
Thanks for reading.