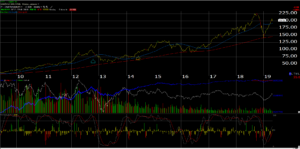
This weekly chart of Apple shows that – while the stock has had a nice bounce since the December ’18 lows, it remains well below its all-time-high from the 3rd quarter of 2018 near $230.
Here is the trend in Apple’s forward EPS consensus (source: IBES by Refinitiv)
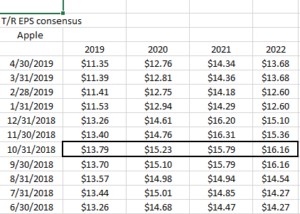
The highlighted, blocked area shows Apple’s forward EPS estimates speaking with the October ’18 quarter last year and steadily declining from there.
Here is the trend in Apple’s forward revenue estimates: (Source: IBES by Refinitiv)
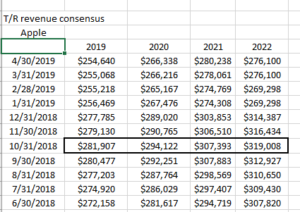
Summary / Conclusion: consensus Street estimates are looking for $57.4 billion in revenue after the bell tonight for Apple’s fiscal Q2 ’19, generating $2.36 in EPS for year-over-year declines in revenue of 6% and 14% respectively.
Here is what isn’t shown: Apple’s “average” revenue and EPS growth as it’s currently being forecast through fiscal 2021 is 7% and 2% respectively, which obviously changes month-to-month and quarter-to-quarter, but the Street is expecting continued iPhone revenue and margin pressure, as the business model remains in transition from a Technology Hardware company to a “services” model.
The “next transition” that the iPhone has always hung on during 2013 and then 2015 – 2016 seems less in evidence today as the price of an iPhone keeps people using their older model (as I do).
In the December ’18 quarter, IPhone revenue fell 15% as “non-iPhone” revenues grew 19% y/y, but gross margin fell 400 basis points as the iPhone unit sales fell sharply.
The year-over-year decline in revenue and EPS is worse today than after the first quarter’s results were posted so analyst revisions continue to be negative.
My biggest issue around Apple is that the stock could remain rangebound for years. The Apple streaming services day held a few weeks ago seemed to get a lukewarm response from the Street, as pricing of the service wasn’t clear.
Apple’s stock is up 30% YTD versus the 16% – 17% for the SP 500 so since the market bottom in late December ’18, the stock has dramatically outperformed.
Client’s saw most of their Apple sold between $160 – $170 last May ’18 after a little fundamental homework made me worried about what was happening with Apple’s cash-flow.
The cash-flow-to-net-income ratio is still on a downward track. It will be updated after the call.
Thanks for reading.