Maybe a better question for the headline to today’s blog post would have been, “What about the weekly SP 500 earnings data would have given clues to anticipating the Q4 ’18 selloff ? ”
To be completely frank with regular blog readers, I didn’t see this deterioration in the SP 500 earnings estimate for 2019 coming nor did I think it would be as steep or severe as it has turned out to be.
Two strategists who did catch the deterioration (and below I’ll show readers what key metric was being watched) early on were LizAnn Sanders of Schwab (Trinity custodies all client assets with Schwab as 3rd party custodian) and Bob Doll of Nuveen.
Going back and looking at the data from late September ’18 forward, it was the “4-week change” in the 2019 SP 500 estimate that started to deteriorate first:
Note in the above data set how in late September, 2018 the “4-week change” row turned negative and then really started to deteriorate in late November ’18.
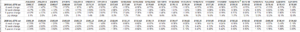
As a comparison (see spreadsheet data below), note the “4-week change” in the SP 500 2019 EPS estimate from 9/21/18 back through early May, late April, 2018 (reading from left to right):

(All data sourced from I/B/E/S for Refinitiv)
The 4-week change was always positive for the bulk of 2018, until late September ’18.
——–
So that brings us today: what does the current SP 500 earnings data tell us ?
- Fwd 4-qtr est: $168.27 vs last week’s $168.65
- PE ratio: 16.6x
- PEG ratio: 4.89x
- SP 500 earnings yield: +6.03% vs last week’s 6.08%
- Year-over-year growth in fwd est: +3.4% vs last week’s +3.6%
(Source: I/B/E/S for Refinitiv as of 2/22/19)
Summary / conclusion: My friend Jeff Miller, who writes the very popular blog (www.adashofinsight.com) encouraged me to start this blog in 2012 since Jeff knew I wrote about SP 500 earnings regularly. The problem, like any metric used for “predicting” the direction of the SP 500 is that one has to ask is the metric a leading indicator, coincident, or even a lagging indicator ? The 13% Q4 ’18 correction in the SP 500 and reviewing the data since tells me that the “4-week” change (in this case the 2019 EPS estimate) had some predictive ability at least to this last correction.
Although this blog has been around since 2012, SP 500 earnings data has been tracked since 2000, and as has been written on this blog many times over the years, the “forward 4-quarter” estimate” for the SP 500 didn’t actually peak until the week of July 23rd – 25th, in 2008, just 5 – 6 weeks prior to Lehman defaulting.
When the long-term chart of the SP 500 is overlaid on an SP 500 earnings chart (or vice versa) the two are usually highly correlated, particularly if you look at the 2001 – 2002 recession and then the 2008 recession. But the question remains is there a “leading indicator” type component to the earnings that would aid in “market-timing” and if so, would the same indicator get you back into the SP 500 at or near the bottom ?
The SP 500 fell 13% in Q4 ’18 and is already up 11% in calendar ’19 and more so if we look at the bottom from December 24th and December 26th, 2018, and yet the SP 500 earnings data according to the first data set is just starting to get “less worse” from a rate of change perspective. (So far anyway, if readers want a classic example of why not to “market time” the 4th quarter correction was it, even though the SP 500 really needs to take out the Sept ’18 highs near 2,940 to assuage all the anxiety over what lays ahead.)
But here is one aspect to tracking SP 500 earnings I’ve found very helpful: analyzing the sector growth rates over time, noting in years like 2019 presently, when SP 500 earnings growth has been revised lower from 10% as of Oct 1 ’18 to just 4% today, the Financial sector has show little deterioration in its “expected” earnings growth rate of 9% for 2019 which has been constant over the same period. (Maybe the Kraft Heinz news around Berkshire, the sector’s largest market cap weight, will change that growth rate the next few weeks.) Clients remain overweight the Financial sector, and that weight might be lifted even further.
In other words, watching relative sector growth rates has been a good tell for me as a portfolio manager, and divergent anomalies are even better tells, as Financials currently are currently demonstrating.
The whole point of today’s post was to take the time and analyze some of the data from the correction period in Q4 ’18, and then share the frustration with readers on picking out predictive tells. Will the “4-week rate of change” work for the next correction ? Tough to say. You can bet I’ll continue to watch it now.
What about full-year 2019 SP 500 earnings ? Will the benchmark’s earnings growth be just 4% in 2019 ? I actually think earnings growth should get stronger through 2019 as it did through 2016, but more on that tomorrow.
Thanks for reading.