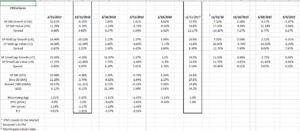
The bounce in the various US equity asset classes since December 24th and December 26th, is resulting in the small and mid-cap sectors within the SP 500 outperforming large-cap and growth for the first time in – well – a while.
If readers would look at the attached spreadsheet, the last time we saw small and mid-cap “value” outperform “growth” was 2016.
Will this last ?
It’s hard to say.
Summary and conclusion: The dramatic ‘style” out-performance by large-cap growth since the last correction in Q1 ’16, might be coming to an end. The plan is to keep readers updated usually every 6 weeks at the end of each quarter and then mid-quarter, but the returns aren’t always posted in a timely fashion.
Here is the thing though for readers: with every substantial correction in the SP 500, typically the ensuing rally is always somehow different than the rally prior to the correction. Just look at the Energy sector – the Energy sector was 14% – 15% of the SP 500 by market cap as of August, 2014 and then the collapse in the price that eventually bottomed in Q1 ’16 near $28 per barrel, but Energy’s market cap as a percentage of the SP 500 hasn’t gotten anywhere close to that 14% – 15% weight.
With every correction, each ensuing bull market rally is always somewhat different in nature, leadership, etc.
Small and mid-cap value have been in the penalty box for the last few years. Will they now lead again ?
Thanks for reading…