Talking with my yoga instructor this week about the market – she does one-on-one yoga sessions with many CME traders and hedge fund types – and while explaining I really wasn’t a trader for my clients, but more of a long-term investor she then asked about the market and how all she hears about is the negatives, my only response was “2008 changed everything” and then immediately thought, “that’s the title of the weekend blog post”.
The October ’18 low for the SP 500 was 2,603.54 and the close on Friday night, November 23rd was 2,632.56, so we could see a retest of the October ’18 lows as soon as Monday.
The yearly low for the SP 500 was early Feb ’18 and that was 2,532.
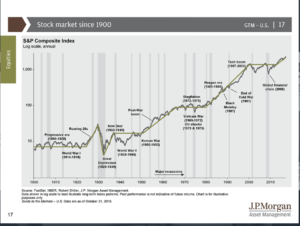
The above chart which comes from JP Morgan’s “Guide to the Market” is now the first chart shown to clients and prospects at every meeting.
While the charts scale can diminish the severity of the two 50% bear markets from 2000 through 2009, it also shows the breakout in the upper right-hand corner and what is likely the birth of the current secular bull market in the SP 500.
Is the secular bull market that began in March, 2009 now complete ? Do most readers know that it wasn’t until May, 2013, that the SP 500 made a new all-time-high, and thus you might make the case that this bull market is just a little over 5 years old ?
Here are the issues that are like a wet blanket on the current tape:
1.) China and the trade tariffs: this impacts almost all parts of the US economy. 40% of SP 500 revenue is now non-US. The G20 starting this week MIGHT see some language that softens the potential for a trade war. China is now the world’s 2nd largest economy and what happens with tariffs matter. All of this states the obvious – I think any kind of clarity or resolution to the China trade issue would help US markets.
2.) Interest rates: the FOMC will raise the fed funds rate by another 25 bp’s to 2.5% on December 19th, 2018. The Fed/FOMC/Powell have said that “neutral policy” is a 3% fed funds rate, which means at least another two increases are planned in 2019. If nothing else trade tensions and new tariffs if they happen – you would think – would result in a more neutral monetary policy.
3.) Brexit: the world’s 5th largest economy and the Brexit fatigue you would think would eventually have an impact on the UK and the EU economy. Think of the uncertainty for businesses in the UK on what Brexit might look like and what the impact might be for them. The longer it drags on and Parliamentary infighting occurs, the bigger the drag on the UK economy. Here are the key dates for Brexit negotiations.
4.) Italy – seems to be a much smaller version of Greece back in 2010 and 2011, but is nonetheless the Italian bond market is unsettled. In and of itself it would probably be nothing, but combine it with DeutscheBank in Germany, the EU struggles around Brexit and it’s no surprise the European economy is a mess.
5.) Middle East and crude oil: the Jamal Khashoggi was a truly heinous crime. Is higher Middle East crude oil production and thus lower gas prices a form of mea culpa by MBS ? Some of the perma-bears read the drop in crude oil prices as an indicator of the global economy slowing, but I suspect it is due to higher crude supply, whether from the Middle East or the US. The conventional wisdom is that the drop in gas prices is like a tax cut for the US consumer. That was true during the 1980’s and 1990’s but perhaps less so today. You didn’t hear about the tax cut much from late 2014 to Q1 ’16 when crude oil fell from $90 to $28. Lower-end retail like a WalMart or Target will benefit from the gasoline price drop. The drop in crude prices is another reason for the Fed and Jerome Powell to pause too.
6.) The “debt bomb” or so-called “fallen angels” are previously-rated investment-grade debt that fall to junk-rated levels. The biggest worry is General Electric’s debt which is still rated investment grade, but the bonds themselves are trading at “junk” or below-investment-grade credit spreads. GE (the stock) fell another 3% on Friday, November 23rd and couldn’t hold the $8 price level. The $31 billion in pension liabilities and worries over the reserve’s on the long-term-care insurance book make me wonder why the stock was ever rated AA-. High-yield credit spreads have started to widen out (see chart below).
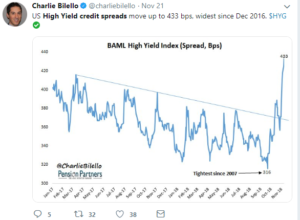
The HYG or the iShares High-yield Bond ETF fell 1% last week. The HYG has a 15% Energy weight and commodity companies tend to be high-yield issuers.
Clients have had no interest rate or credit risk in 2018. High-yield will only be bought after yields get up to 10% or so.
7.) The stronger dollar will also put a crimp on SP 500 components with a larger percentage of their revenue being Non-US. Would love to see the dollar weaken or at least stop rising.
8.) Investor sentiment – from a contrarian perspective – remains an unambiguous positive:
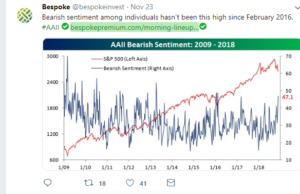
“Breadth” was actually positive the last few days of Thanksgiving week, which seems surprising given the drop in the indices this week. The sentiment though – being as bearish as it is – remains the significant tell and the leftover effect from 2008 to which the title of this blog post refers.
Summary / conclusion: The one residual effect from 2008 that consistently stands out is how bearish investor sentiment rises quickly on market pullbacks while bullishness builds very slowly on market rallies. At the end of the 3rd quarter, 2018 when the SP 500 was +10% year-to-date (YTD), and the Nasdaq was up near 20% YTD, investor sentiment “bullishness” as measured by Bespoke (and AAII), was just 48%, still well short of the bull market highs from the late 1990’s and the mid-2000’s.
You’ve now seen a whole generation of American’s that experienced the decade from 2000 through 2009 – two bear markets in the SP 500 of 50% each, both in 2001 and 2002 and then again from 2007 through early 2009 – that think this is probably “normal” market action. Prior to 2001 – 2002 there was just one 50% bear market in the SP 500 in the post WW II period, and that was 1973 – 1974, and it happened around Watergate, OPEC and a pretty grim US economy from the oil crisis.
The largest correction in the SP 500 since the March, 2009’s market bottom was 20%, and that was in 2011, and yet viewing investor sentiment data you’d think we were in the midst of the Great Depression.
Here is a note (which sums up the point pretty well) from the technical analyst Helene Meisler and her blog over at RealMoneyPro, where Helene writes (and I am a subscriber) for Jim Cramer and the RealMoneyPro audience:
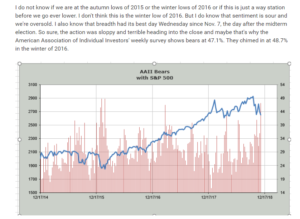
Sometimes things can go right. Like in Q1 ’16 at which point an 18 month rally began.
The October ’18 low for the SP 500 was 2,603.54. If the SP 500 closes below 2,600 – 2,603 on heavy volume then the SP 500 will likely retest the February, 2018 low of 2,532.
Thanks for reading.