Dr. David Kelly and his team at JP Morgan put together one of the best research and market / economic summaries on the Street (published quarterly) and that is the JP Morgan “Guide to the Market” (GTTM).
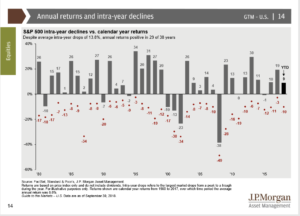
The above graph (from the October 2nd Guide to the Market) notes the peak-to-trough corrections each year for the SP 500, the last 38 years.
The AAII data out Thursday morning, 10/14, noted that “bullishness” among retail investors had fallen to 30% after just reaching 46% at the end of September ’18. (This blog has addressed the AAII survey and whether it is truly representative of market sentiment but the fact is Bespoke Research still uses AAII and the AAII sentiment survey data is still published regularly every week, so whether the data set is appropriate, it is one of the primary surveys that gets used frequently as an investor sentiment source.)
What continue to surprises me about this post-2008 stock market: it isn’t how relatively calm and unemotional the stock market’s ascent has been the last few years, it is the extreme rapidity with which retail investors turn tail and lose their enthusiasm, or turn less bullish on the stock market with the slightest pullback. And the sentiment doesn’t just turn neutral, it turns bearish as noted by the 10% increase in those bearish within the AAII survey this past week.
Summary / conclusion: The one thing that struck me about the above bar chart from JP Morgan is that from 1980 to 1999, or the 80’s / 90’s bull market, there were 7 years where the SP 500’s return was greater than 25%. Since 2009, there has only been one year – 2013 – where the SP 500 return was greater than 25%.
Also note that since the truly-frightening 20% intra-year decline in the SP 500 in 2011, there has not been one year since where the SP 500’s “peak-to-trough” correction has been even “average” i.e. 13.5% in depth.
If S&P 500 returns are becoming less volatile, it would make sense after last decade. I frequently tell clients that they lived through two (not one) 50% corrections in the SP 500, from 2000 – 2002 and then again in 2007 – 2008, which was the first time that has happened since the 1930’s. Seriously, prior to 2000 – 2002, the last time the SP 500 corrected 50% was the 1973 – 1974 bear market around Vietnam, Watergate, the OPEC oil crisis and 10% consumer price inflation.
Ryan Detrick (@ryandetrick), an LPL Financial market strategist who is an excellent resource for statistical data around the SP 500 and the US stock market, noted many times towards the end of the 3rd quarter, 2018, that the quarter was one of the calmest on record for market volatility.
The pullback since Sept 30th, 2018 for the SP 500 and the Nasdaq isn’t even average yet.
Investors seem to be rattled more easily, even as the SP 500 seems to be becoming less volatile, and perhaps it’s what can be called the “2008 effect“.
Thanks for reading.