The weekly earnings commentary will be out tomorrow, i.e. Saturday, August 4th, 2018. However today, I thought readers would be interested in looking at some “SP 500 Revenue” stats.
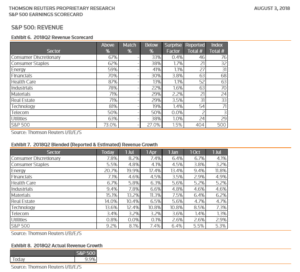
1.) Despite being the sector showing the fastest EPS and revenue growth year-over-year (y/y), Energy is showing the lowest beat rate for revenue, at just 59%. The only sector worse is Telco at 50%. Chevron had a big revenue miss for the 2nd quarter of 2018, while Exxon had a big revenue beat, and Exxon’s market cap is larger than Chevron’s by about $100 billion. the lesson for readers is that high expectations are everything in investing. The positive revisions and the high y/y growth rates in Energy resulted in lofty anticipation heading into Q2 ’18 reporting season for the Energy sector.
2.) Consumer Discretionary is the only sector to see lower expected revenue growth as of August 3rd for Q2 ’18 reporting season versus July 1 ’18. The remaining sectors all show stronger expected revenue growth for Q2 ’18 as of August 3rd versus July 1 growth rates.
3.) Note the Telco sector – note how many companies are in the sector and you know why Standard & Poors is creating the “Communications” sector in September ’18. It’s like the horse-and-buggy sector.
4.) Note how the Financial sector has the strongest “upside surprise” factor of the 11 sectors.
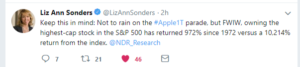
Interesting Tweet from Schwab’s LizAnn Sonders:
CNBC does – for the most part – a nice job covering the capital markets, but it’s no exaggeration to say they beat the “Apple $1 trillion market cap” to death like they beat the “Dow 10,000” to death in the early 2000’s.
Client’s own only a quarter, maybe less of the iPhone giant than they did in Q1 ’18. Apple’s unit growth was just 1% y/y in iPhones and iPad’s and -13% in Mac’s but the average selling price (ASP) for the iPhone was up 20%. That’s a plus for the tech giant. Surprising pricing power. Readers will laugh and have many “thoughtful” comments on the stock and the sale, but the ability to raise prices like that is quite antithetical to Tech Hardware’s business model in the last 20 years. (This is discussed further below.)
Despite the ASP increases Apple’s operating margin remained flat y/y and is down from 27% to 23% in the last several years. Apple’s effective tax rate in the June ’18 quarter was 13% too, down from 15% in fiscal Q2 ’18.
However talking negatively about Apple is like pointing out the small pimple on your supermodel girlfriend’s forehead, i.e. it’s not going to get you very far, other than a purse across the face.
Strategas Partners:
Chris Varrone, Strategas’s excellent technician, came through Chicago this week and I was lucky enough to get an invite to the small lunch gathering. Chris is very good and a frequent technical analyst on CNBC’s FastMoney, at 4 pm central every day.
His two best thoughts in my opinion:
1.) Everyone is worried about the inverted yield curve, but Chris thinks the time to really get interested in the inversion aspect is when the fed funds is higher than the 2-year Treasury yield. We are still a ways away from that.
2.) “Everyone is worried” per Chris and he has a great point. AAII bullish sentiment is still in the low 30% range. Also, per Chris’s technical work, all the “safety trades” that worked from 2009 – through 2012, and even a little longer, like Staples, REIT’s, Utilities, Gold and Bonds are still under water.
Vitaliy Katsenelson:
“V” is CIO at the Denver-based Investment Management Associates firm, and a long-time acquaintance from our days on TheSreet together in the late 1990’s, early 2000’s. Vitaliy wrote an article of how consumer purchasing patterns have changed over the years and one of the big changes was the cell-phone bill, which is now a staple of probably every home in America, replacing the landline to some extent but with kid’s, you’d have to think the average household cellphone bill is now quite a bit fatter than your average phone bill from the 1980’s. (Couldn’t find Vitaliy’s article to attach.)
My final point or question to readers that ive wondered is, “How inflationary is the iPhone price increase ?”
In the early 1990’s, i used to write economic commentary for a small firm where i worked and learning about the inflation measures, the CPI and PPI are “fixed-weight” indices. A fixed-weight price index measures the exact same basket of goods across various time periods. In the early 1990’s, the personal computer wasn’t picked up in the CPI or PPI data (even though by that time, they were being bought for every home) but you had to look at the deflator (deflator indices try to adapt to changes in consumer purchasing behavior) to find the PC price impact and given the technology pricing curve, you were buying ever faster PC’s (RAM) with more memory and storage at consistently lower prices, which is the productivity dream that we’ve all read about in economic texts.
The iPhone pricing is working the opposite of that – that’s what worries me about Apple. Sure the iPhone is getting better, but you are paying a lot more for every upgrade too.
More to come tomorrow.
Thanks for reading.