(This blog’s RSS feed is going away or has gone away so please resubscribe at www.fundamentalis,com if you haven’t already. There is no cost to subscribe to the blog. )
Not much difference in the numbers so far this year.
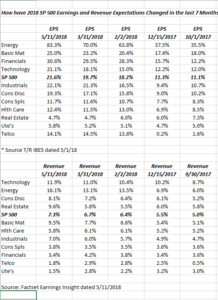
Telco earnings have jumped, but some of that or a big part of that was an accounting change for the sector and yes, tax reform.
Telco revenue estimates have continued to see pressure which is consistent with AT&T’s disappoint quarter and revenue miss.
Real estate earnings as a sector have fallen. The sector isn’t followed that closely since real estate is just 3% of the SP 500 by market cap, as is Telco, Basic Materials and Utilities, too.
Tech, Financials, Health Care and Consumer Discretionary, is still roughly 65% of the SP 500 by market cap.
Technology and Financial’s have been clients largest sector overweight’s for years, coming off the 2009 lows, although Tech is lighter in weight in 2018 than it was in 2017.
It’s still a relatively healthy stock market.
More to come Saturday morning on the Weekly SP 500 earnings data and update.
Thanks for reading.