(This blog’s technology consultant has asked me to notify subscribers that this blog’s “RSS feed” is going away, and that it is necessary for readers to subscribe or resubscribe (there is no cost for subscribing) to www.fundamentalis.com in order to receive an email when this blog is updated. What we’ve realized over the last few months is that emails are not being received from readers that respond to blog posts, either wishing to further discuss a point raised in the blog, or to simply ask a question, and that isn’t what we want. The interaction and discussion with readers is important, and one of the reasons the blog was started. Please subscribe/resubscribe at www.fundamentalis.com, and if you have issues, email me directly at brianglm@trinityasset.com).
————————-
With Apple’s price action last week, part of which you’d have to think was driven by the intense interest and coverage of Berkshire Hathaway’s “Woodstock” (i.e. annual meeting) in Omaha this weekend, this blog update was posted Friday, May 4th, after Apple’s stock rose 3.5% on the day and 13% on the week.
I thought it necessary to clarify what i thought was happening with Apple, how it impacts the relationship between cash-flow and net income, and also talk about what else might be happening with the stock.
For background, the relationship between cash-flow and net income first came to my attention in the early 2000’s with the post-mortem around Enron and identifying the analysts and portfolio managers that were right about Enron well before the stock collapsed. To be clear, in no way, shape or form is Apple anything close to resembling Enron, but when it was disclosed that Jeff Skilling and Fastow had the Merrill Lynch (Houston) Energy analyst fired because he went south on Enron, with the further disclosure the analyst noted that one of the reasons he went south on Enron was the deteriorating relationship between Enron’s cash-flow from operations and net income, it was a relationship that was tracked for many companies I follow as well.
The Merrill analyst concluded that net income (and thus earnings per share) was being gamed, and it showed up in the relationship between cash-flow and net income.
In no way do i think Apple is “gaming” anything, but the relationship between cash-flow and net income was tracked over years, per our spreadsheet updates on the stock.
Since Apple’s gargantuan free-cash-flow generation and cash repatriation has the financial media playing that dynamic to the hilt (for good reason), I thought it important to post the update on Friday, May 4th just to show readers the trend.
Here is some further analysis done over this weekend:
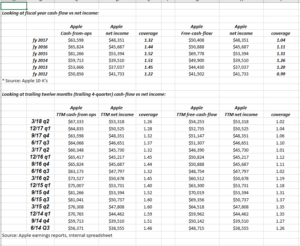
This is pretty geeky stuff:
1.) The top part of the first table shows the relationship between cash-flow and net income for the fiscal years 2012 through 2017. Since the year 2013, which is the first year the stock corrected 50% peak to trough, (from $100 down to $50), cash-flow’s coverage of net income began to compress.
2.) The “trailing twelve-month” data, which is further detail than the blog post this weekend (showing free-cash-flow coverage of net income as well), also shows the steady decline of cash-flow and free-cash-flow coverage of net income.
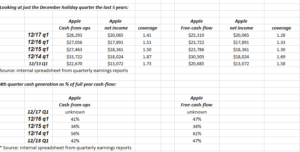
3.) The last two tables are an aspect to Apple’s business Ive been curious about for a while, i.e. how much of Apple’s total business is done in the December quarter every year, and the coverage trend is similar albeit a little more stable, but readers can see that during iPhone upgrade cycles, the holiday quarter is a big part of every year’s cash-flow.
Analysis / conclusion:
Companies that can cover net income with free-cash-flow as Apple still can, (2nd table, 2nd set of columns to the right, showing free-cash-flow covering net income at 1.02) are still very healthy businesses.
This isn’t a question about Apple’s viability or durability.
What this is telling me is that there is something changing about Apple’s business model that is resulting in less cash-flow generation for dollar of net income.
Look at the bottom half of the first table: note how the “trailing twelve month cash-flow” in the December ’15 and March ’16 quarter is still higher than Dec ’17 and March ’18.
Again, there is some aspect to Apple’s business that is resulting in somewhat reduced cash-flow generation. Like a marathoner that has run the first 20 miles at a solid pace, and is now starting to labor, as the grind becomes harder.
One metric not shown is Apple operating margin: for the 16 quarters from June, ’14 to March ’18, Apple’s operating margin “averaged” 27.8%. The issue is that from June ’14 to March ’16, or the first 8 quarters, Apple’s operating margin averaged 29.3%, with the last 8 quarters, from June ’16 to March ’18, Apple’s operating margin averaged 26.2%.
Over the last 4 years, Apple’s operating margin has compressed 300 bp’s.
It is the trend here that has me worried. Apple is the most iconic brand of – certainly – the last 20 years, and maybe even my generation, and its profitability and cash-flow generation not to mention its market cap of $932 billion as of Friday’s close is historic, and worthy of great acclaim, but something is eroding the tech giant at its core.
Apple’s Services business is what interests me in that it looks to be an annuity business and nowhere near as capital intensive as handset manufacturing, but maybe not the sustainable competitive advantages (the moat) that the iPhone has (remarkably) sustained.
The fact that Apple seems really dependent on iPhone price increases over the next few years, might end up biting the tech giant in the backside. iPhone unit growth (y/y) was just 3% in the March ’18 quarter.
Thanks for reading.