Here are the last 3 weeks closing value for the SP 500:
- 05/4/18: 2,663.42
- 4/27/18: 2,669.91
- 4/20/18: 2,670.14
- Here is the last 3 weeks closing yield on the 10-year Treasury:
- 05/4/18: 2.945%
- 4/27/18: 2.95%
- 4/20/18: 2.95%
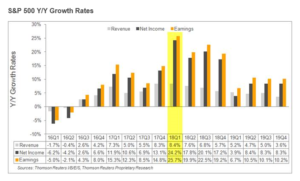
Chart explanation: David Aurelio put a quick chart / table for me showing the difference between year-over-year (y/y) EPS growth versus y/y net income growth.
What’s the important difference ?
The difference between net income growth and EPS growth shows the impact of share repurchases on the index.
Looking at the above table, Q1 ’17 was the biggest share repurchase attribution to the overall SP 500 where net income growth was 11.9%, versus the SP 500’s EPS growth of 15.3%. Share repurchases added 3.4% of EPS growth in Q1 ’17.
In Q1 ’18 the growth difference in EPS vs net income is just 150 bp’s or 1,5%.
The conclusion to be drawn is that – if you study the table – share repurchases aren’t having a big impact on y/y EPS growth despite Apple’s monster $100 bl repurchase (or planned repurchase).
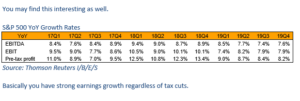
This table was a little surprising: despite faster revenue growth over the last 8 quarters, “pre-tax” profit has changed little within the SP 500. David Aurelio’s point was that pre-tax profit growth is strong, even without the tax cuts. Do I like tax cuts ? Absolutely – living in Chicago and Illinois, I’d much rather have tax cuts, than not have tax cuts, but so far “pre-tax profit growth” has increased just 1% or 100 basis points year-over-year.
Here is the weekly SP 500 earnings update (by the numbers):
- Fwd 4-qtr est: $163.10 vs $162.43
- PE ratio: 16.3x
- PEG ratio: 0.79x
- SP 500 earnings yield: 6.12% vs last week’s 6.08%
- Year-over-year gro of fwd est: +20.76% vs 20.29% last week
(Source: Thomson Reuters IBES This Week in Earnings, 5/4/18)
Conclusion:
The SP 500 earnings yield is at a 4-week high and while its not a timing tool, it speaks to the relative attractiveness of the benchmark’s value with a yield still over 6%.
The SP 500 has tested its 200-day moving average 3 times, successfully, but cannot make headway.
Here is why Apple’s overweight position was reduced to an underweight position in client accounts (here).
The last 2 non-farm payroll reports have been weak, and the 10 and 30-year Treasuries have rallied little or not at all.
Thanks for reading.