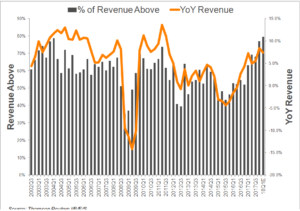
Here is a good graph of SP 500 revenue growth, courtesy of David Aurelio of Thomson Reuters I/B/E/S.
Although it seems like ancient history, readers can see the burst in revenue growth after the Tech collapse in early 2000’s, and with the start of the Gulf War in March, 20003, the US economy started to re-accelerate in terms of GDP growth, and SP 500 revenue got a nice burst too.
Im trying to think about what happened in 2010, and 2011 and again you could say the US economy re-accelerated off the March, 2009 stock market low, but what is curious about the graph and the data set, its that y/y SP 500 revenue growth was actually strongest in 2010 – 2011, particularly in Q3 ’11, when the SP 500 had just concluded a 20% correction that year.
The Energy sector was strong at this time, and I’m talking 2010 – 2012 when it was 14% – 15% of the SP 500 by market cap. Looking at a longer-term charts of WTI and Brent both rallied sharply off the 2009 lows to the $100 – $110 area from 2010 to 2013, so Energy could have had a substantial impact on SP 500 revenue growth, offsetting slower Technology and Financial Services growth during the post-2008 malaise.
Conclusion: Both the SP 500 revenue beat rate (black bars) and the y/y growth (orange line) are trending in the right direction as we head into Q1 ’18 earnings.
Looking at the weekend’s earnings post the expected Q1 and Q2 ’18 revenue growth rates are expected at 7.4%, continuing some of the best revenue growth since 2010 – 2012. Energy is once again the sector leading the way. Here is a quick look at Q1 ’18 revenue growth ranked by strongest to weakest sectors:
- Energy: +14.3%
- Tech: +13.9%
- Materials: +11.8%
- Industrial’s: +7.7%
- Real Estate: +6.9%
- Cons Disc: +6.6%
- H/Care: +6.4%
- Cons Spls: +4.4%
- Telco: +4%
- Fincl’s: +3.4%
- Ute’s: +1.7%
- SP 500: +7.4%
Energy is way overbought here. Technology, Financials and Health Care are still over 50% of the Sp 500 by market cap.
Look for a little stronger revenue growth from Financial’s in Q1 ’18. Goldman Sachs had a big revenue beat this morning.
The point of the blog post is that revenue growth matters, but like so many things in investing “correlation is not causality”.
Still, the trend in revenue growth (see the spreadsheet from the weekend’s earnings update linked above) is encouraging.
Thanks for reading…